A life cycle analysis (LCA) for a product is a comprehensive method used to assess the environmental impacts associated with all stages of a product’s life. This includes raw material extraction, materials processing, manufacture, distribution, use, repair and maintenance, and disposal or recycling. Here’s a simple overview of the key aspects of a life cycle analysis:
Purpose of LCA: It is primarily used to evaluate the environmental footprint of a product from “cradle to grave.” It helps in understanding the complete picture of the environmental impacts and identifying opportunities for improvement in the product’s life cycle.
Conducting an LCA: The process usually involves several steps:
Goal and Scope Definition: Determining the purpose of the LCA and the boundaries of the study (e.g., which life cycle stages to include).
Inventory Analysis: Gathering data on the energy and material inputs and environmental releases associated with each stage of the product life cycle.
Impact Assessment: Assessing the potential environmental impacts of the data collected in the inventory analysis, often categorized into different impact areas like global warming, ozone depletion, water pollution, etc.
Interpretation: Analyzing the results to make informed decisions or recommendations.
Data Sources: The data for LCA comes from a variety of sources, including:
Empirical data from specific processes or locations.
Industry data or databases that compile information on material production, energy use, emissions, etc.
Published literature and government reports.
Standardization: LCA is standardized through international standards such as ISO 14040 and ISO 14044. These standards provide guidelines on principles, framework, methodology, and reporting of LCAs. They ensure consistency, transparency, and credibility in the LCA studies.
How We Use LCAs
We use LCAs to help us understand the environmental footprint of a product. This can help us answer questions like these:
What types of products have the biggest or smallest environmental impact?
How do different types of packaging for bottled beverages impact the footprint of those products?
How can we make informed decisions to use products that have a smaller footprint?
Whenever possible we use LCAs that have been peer-reviewed and published in reputable scientific journals. This increases our confidence that the LCA data is accurate and the process used has been vetted by experts. It’s important to remember that even the best LCA is still an estimate of a product’s environmental footprint. It often gives us a good approximation, but not the exact impact, which is going to vary product by product as the inputs can vary.
Global Warming Potential (GWP) is a crucial metric used within the context of a Life Cycle Analysis (LCA) to measure the potential impact a substance has on global warming.
GWP is vital in a LCA because it provides a standardized method to evaluate and compare the climate change impacts of products, processes, or services.
More Info:
Definition of GWP: GWP is a relative measure that compares the amount of heat trapped by a certain mass of a greenhouse gas (GHG) to the amount of heat trapped by a similar mass of carbon dioxide (CO2). Essentially, it is a way of quantifying how much a given GHG contributes to global warming compared to CO2.
Time Horizon: GWP values are typically calculated over specific time horizons, such as 20, 100, or 500 years. This is because different gases remain in the atmosphere for different lengths of time and have varying short- and long-term effects on temperature.
Use in LCA: In an LCA, the GWP is used to assess the potential climate change impact of different emissions across a product’s lifecycle. It enables the comparison of the impacts of different GHGs in a common unit. For instance, if a product’s lifecycle releases methane and CO2, the GWP allows these emissions to be converted into a CO2 equivalent (CO2e) value based on their respective GWPs, facilitating a more straightforward comparison and aggregation of climate impacts.
Importance: GWP is vital in LCA because it provides a standardized method to evaluate and compare the climate change impacts of products, processes, or services. This helps in identifying areas with significant GHG emissions and opportunities for reducing environmental impacts.
Data and Standards: GWP values for various greenhouse gases are provided by scientific bodies like the Intergovernmental Panel on Climate Change (IPCC) and are used in accordance with international standards like ISO 14040 and ISO 14044 for LCAs.
How We Use GWP
We use GWP as a measurement of a product’s environmental footprint. This allows us to compare the impact of different products and how variations within a product – like using plastic vs glass in bottles – affect its environmental impact.
Products with a higher GWP have a bigger environmental impact. Generally we are evaluating and comparing products to find the ones with the lowest GWP, so we can make more informed purchasing decisions and lower our own environmental footprint.
I’ve used the first 2 strategies outlined here to significantly reduce my own environmental footprint and considerably improve my health. I’ve included the third strategy an another viable option.
Take what works for you… and thank you for your effort to reduce plastic waste!
Strategy 1: Switch Away from Plastic Bottles
Continue enjoying the same drinks you like, but move away from plastic… in most cases. This is the first strategy not because it has the biggest impact (see Strategies 2 & 3 for that), but because it can be implemented quickly and easily.
In all cases, when the source of the materials are recycled it will be more sustainable than when the source is from virgin resources. So a glass bottle that comes from recycled materials will be more eco friendly than an aluminum bottle made with no recycled material.
Here’s how to help make a selection that fits your desired outcome:
For The Environment
In general, this type of selection process will help you reduce your environmental impact. It’s based on the Global Warming Potential (GWP) of each material.
Go Recycled – The incorporation of recycled material drastically cuts the GWP of a bottle. At the point of purchase you’ll have to look for labels that specifically state the container was made from recycled material. The next best alternative is to look up which brands have recycled containers.
Select by Type – If you can’t find an option that has a high amount of recycled content, the best approach is to select in this order: aluminum, the lightest plastic possible, then glass.
If you weight other environmental factors higher than global warming, you can adjust your criteria accordingly. Here are a few examples:
Natural Resource Extraction / Habitat Damage
You may want to select glass or plastic over aluminum, which has a higher impact when attaining the resources required. Here’s a table summarizing the impacts from the resources required for each material:
Aspect
Aluminum
Glass
Plastic
Source of Raw Materials
Bauxite mining
Sand mining
Petroleum or natural gas extraction
Energy Consumption
High; involves ore processing and smelting
Moderate; melting processes
Varies; generally high for production, especially for virgin plastics
Greenhouse Gas Emissions
High; due to energy-intensive processes
Moderate; primarily from heating processes
High; from fossil fuel extraction and processing
Impact on Biodiversity
Can be significant; deforestation, soil erosion
Localized habitat disruption
Oil spills, habitat disruption
Marine Debris
In the case of marine debris, plastics are by far the worst offender. If this is your biggest area of concern, steer clear of plastics whenever you possibly can.
For Your Health
If you want to steer clear of plastics for health reasons, choose glass whenever possible. Aluminum cans contain a clear lining made of plastic which has historically contained BPA and in many ‘BPA Free’ containers still has very similar alternatives such as BPS.
Recommended Selection:
Glass
Aluminum
Plastic
If you are health-conscious, then strategy 2 might be even more valuable to you.
Strategy 2: Reduce Soft Drink Intake
In most areas of our life, the best thing we can do to reduce our environmental impact is to consume less. In the case of soft drinks, this is also true for our health.
Here’s a simple plan that can help guide you through the process of breaking the sports-drink habit with little to no discomfort:
General Guidelines To Keep In Mind
These elements of habit change have been instrumental in my ability to kick bad habits and pick up healthier ones:
Slow and Steady – You shouldn’t feel like you’re missing anything at first, but after 3-4 weeks you’ll notice a significant difference.
Consistency is Key – If you do feel a strong urge for more soda, then adjust your schedule. You may have gotten to aggressive. It’s better to lengthen your plan than to make it too difficult to follow and end up giving up. If you slip up a day or two, don’t worry about it. Just get back to your normal schedule.
Tracking is Half The Battle – The tracking may seem like a small piece but is actually critical. I have tracked many of my own habits over the years to help overcome them. The simple act of measuring something makes me more aware of it which is at least half the battle.
Celebrate The Wins – You can track the amount of sugar you’re taking out of your diet and the amount of money you’re saving… then celebrate them! I’ve found that taking a moment to congratulate myself after hitting a milestone significantly boosts my motivation to continue.
Substitutions and Adjustments – You may also want to experiment substituting your soft drink with something healthier like flavored sparkling water.
Week 1-2: Initial Reduction
Baseline Measurement: Determine your average daily consumption of soft drinks. A simple estimate will do just fine, but I highly recommend starting to track your intake as soon as possible. Note the time of day you typically drink soda… your body will expect its treat at similar times each day.
Initial Cutback: Reduce your daily intake by 10-25%. You can ramp this up slowly every few days.
High Intake – If you typically drink ~4 bottles a day, cut back by drinking 75% of each can instead of 100%. Instead of trying to cut out 1 can, which will leave you empty-handed at one part of you day, just cut back on volume. Rather than trying to resist finishing the last 25%, pour out the first 25%. These small adjustments will reduce the amount of self-discipline needed to keep you on schedule.
Low Intake – If you’re drinking 1 can or less per day, you can try pouring the first 25% out or switch to the newer, small cans / bottles if available.
Week 3-4: Further Reduction
Halfway Point: Aim to reduce your consumption to half of the original amount by the end of week 4. If this is too aggressive, adjust your schedule. Remind yourself that getting to the end goal slower is much better than never getting there.
Mindful Drinking: Be conscious of when and why you’re drinking a soft drink. Reviewing your tracking log will likely be very revealing by this point. Are you drinking soft drinks purely out of habit, for energy, or with meals?
Week 5-6: Substantial Cutback
Major Reduction: Cut down to 25% of your original intake. You may even be able to reduce the times per day you reach for that soft drink.
Consider Alternatives: You may find it helpful to do a substitution at this point. Flavored water is great starting point and almost all brands come in aluminum cans.
Week 7-8: Minimal Intake
Occasional Treat: After going through this process myself with soda, fast food, and coffee… I still consume them but much less frequently. Instead of a mindless habit or an essential part of my day, they have become an occasional treat. I’ve noticed a significant difference in how I feel and I’ve drastically reduced my environmental footprint.
Reflect on Progress: Observe any positive changes in your health or energy levels, which can be motivating. Don’t forget to celebrate the wins!
The Economics of Divesting
You might find it amazing how much money you’ll save by reducing the number of bottled beverages you buy (check out my video here which covers the environmental and economic savings in this regard). You’ll also stop supporting companies that create single-use packaging.
Strategy 3: Use A Home Soda Machine
A machine that enables you to make your own soft drinks at home can be a more environmentally friendly option over time, depending on how many bottles you displace.
To evaluate the environmental impact of a home carbonation system versus single-use bottles, we need to consider several factors within the three main phases of their life cycle: production, usage, and disposal.
Home Carbonation System
Production: Manufacturing a home carbonation system involves the production of the machine, reusable bottles, and carbon dioxide canisters. This process requires energy and resources but is a one-time environmental cost for the lifespan of the product.
Usage: The primary environmental benefit comes from the reuse of bottles and the reduction in the need for single-use plastic bottles. The carbon dioxide canisters used in these systems are often refillable or recyclable.
Disposal: At the end of its life, the carbonation machine and its components need to be disposed of. If not recycled properly, they can contribute to electronic and plastic waste.
Single-Use Bottles
Production: The production of single-use plastic bottles is resource-intensive, involving the extraction and processing of petroleum products, significant water usage, and greenhouse gas emissions. As detailed above, aluminum and glass have their own environmental impacts to consider.
Usage: Single-use bottles, once used, contribute to waste and often end up in landfills or as litter, where they take hundreds of years to decompose.
Recycling: While these bottles are recyclable, the recycling rate is relatively low. Recycling also requires energy and resources, and recycled materials often have downgraded quality.
Comparative Impact
Resource Efficiency: The home carbonation system, over its lifespan, typically uses fewer resources per liter of carbonated water produced compared to single-use bottles.
Waste Reduction: Home systems significantly reduce the amount of plastic waste generated.
Carbon Footprint: The initial carbon footprint of manufacturing a carbonation system is higher, but over time, it becomes more environmentally friendly compared to the continuous production of single-use bottles.
While the upfront environmental cost of a home carbonation system is higher, in the long term, it is more environmentally friendly than the continual use of single-use bottles. This is due to reduced plastic waste, lower resource usage per use, and the potential for recycling components of the system. For individuals who consume carbonated beverages regularly, a home carbonation system could be a more sustainable choice.
Final Thoughts
For me, an important aspect of employing these strategies is that it sends a signal to friends, family, and companies. It shows each of them that we can live with less plastic and hopefully speeds up our transition to a more sustainable world.
If you have further tips on reducing plastic use, let us know by commenting or reaching out to us on one of our social media channels.
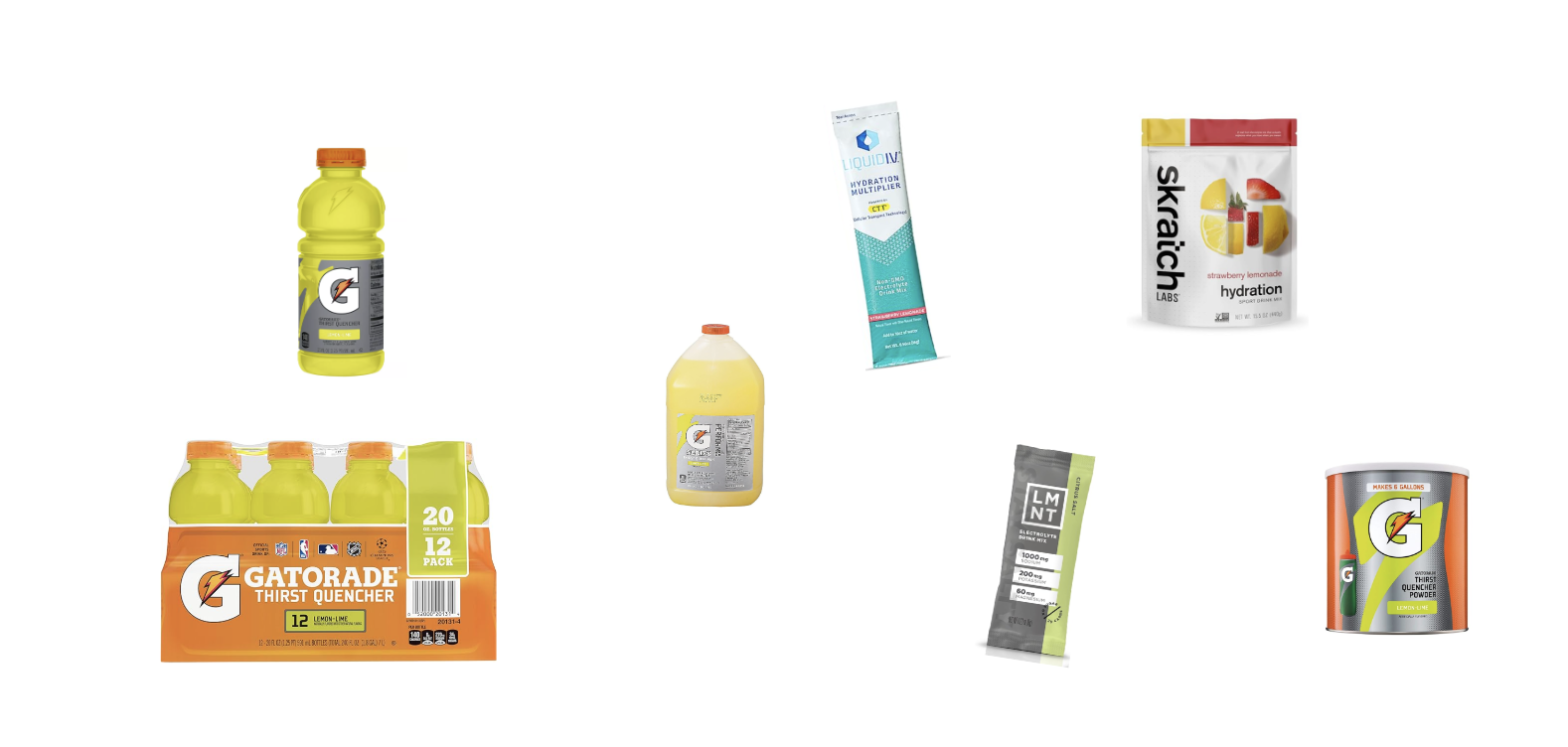
Strategy 1: Use Concentrate Instead of Pre-Packaged
Instead of buying sports drinks in single-use plastic bottles, use a reusable bottle + concentrates.
To understand both the plastic and economic impact of buying bottled sports drinks vs powdered mixes or concentrates, let’s look at Gatorade – the original sports drink.
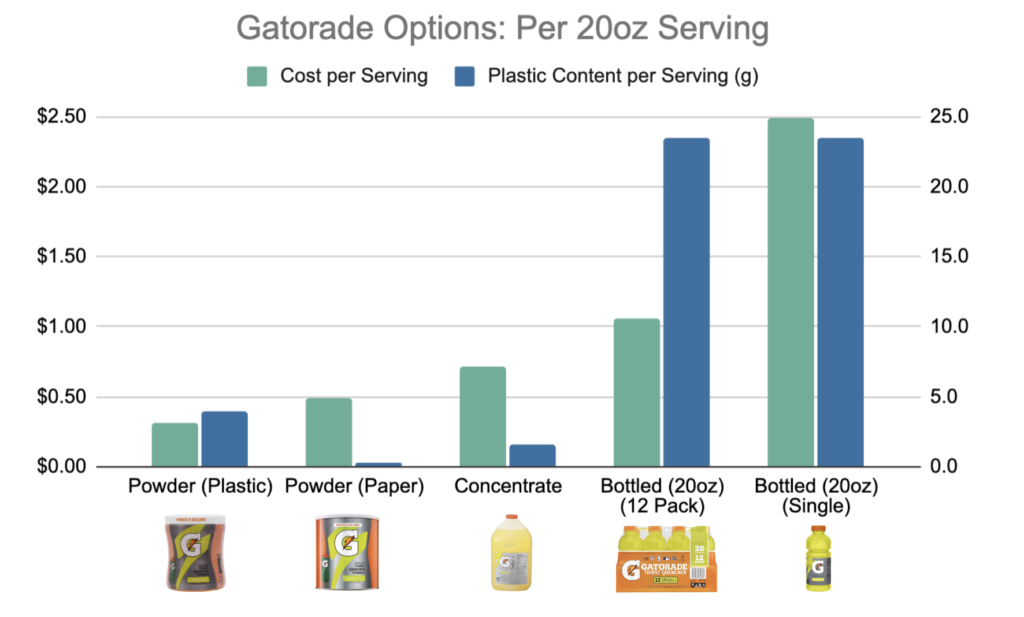
Video Breakdown: Economic & Environmental Impact
Here’s what the difference is between buying bottled Gatorade vs a concentrate or powder mix. I break this down by cost in dollars and amount of plastic produced per serving.
Key Takeaways:
Least Expensive: Powder (Paper Container)
Least Plastic: Powder (Paper Container)
Most Expensive: Bottled Gatorade is much more expensive per serving
A single bottle is 6x as expensive as the powder concentrated alternative
A 12 pack of bottles is 2.6x as expensive as the powder concentrated alternative
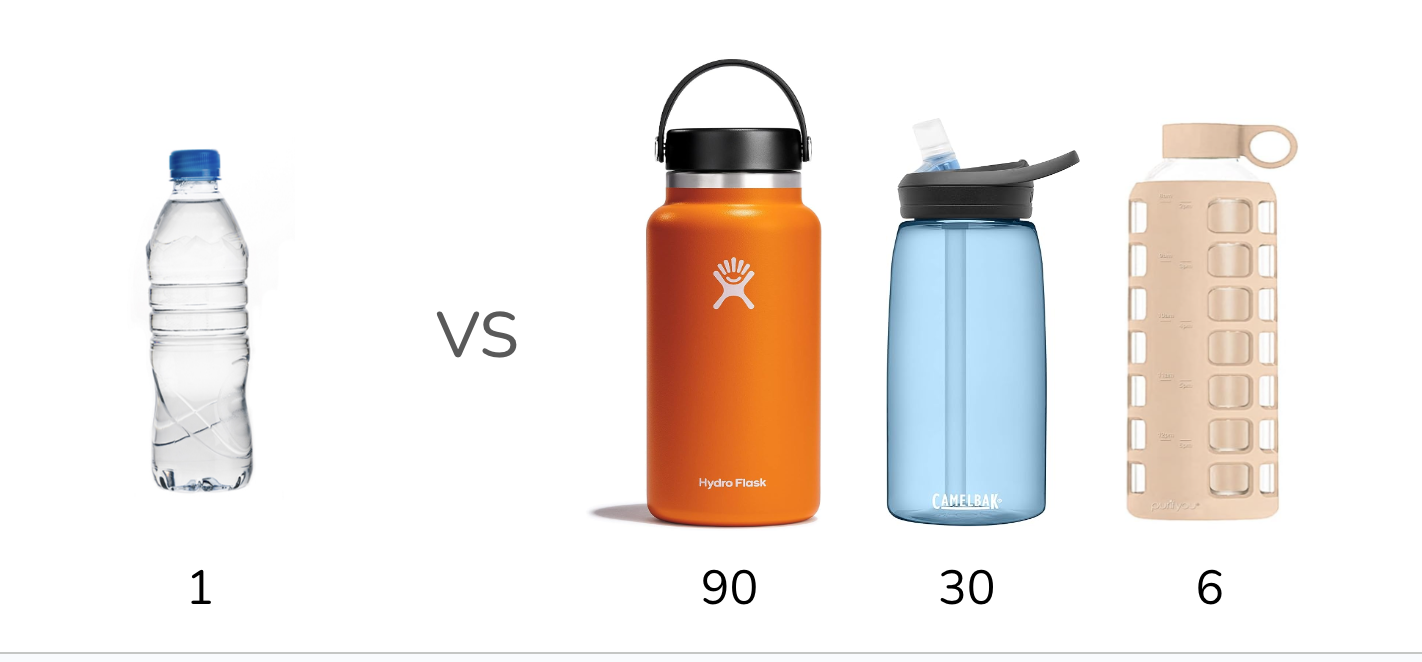
Most Plastic: Bottled Gatorade by far uses the most plastic per serving
6x as much plastic as powder in a plastic container
90x as much plastic as powder in a paper container (plastic lid)
14x as much as the liquid concentrate
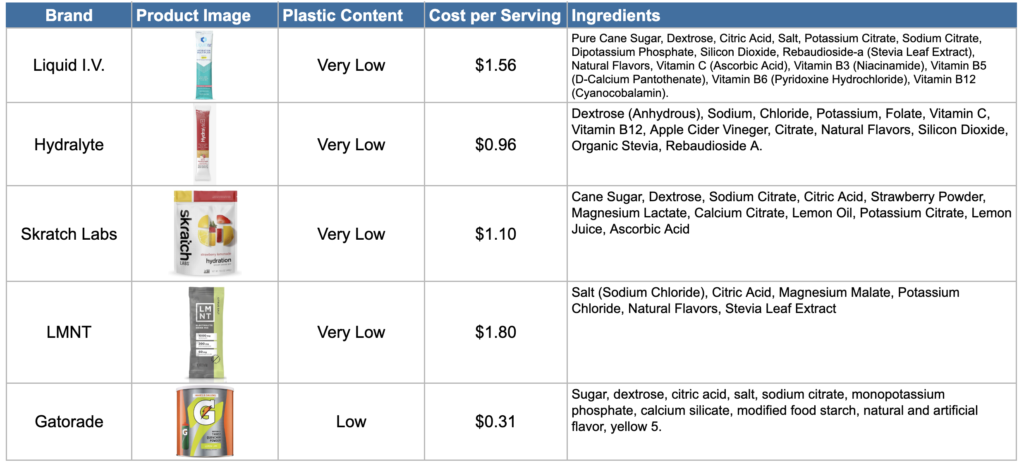
Hydration Powders
Summary
Here is a comparison chart of the top hydration powders on the market.
Serving Size Variations
Each brand recommends a slightly different serving size. The Cost per Serving I have included here is specific to each brand’s recommendation. Here is a break down of costs and servings for each brand:
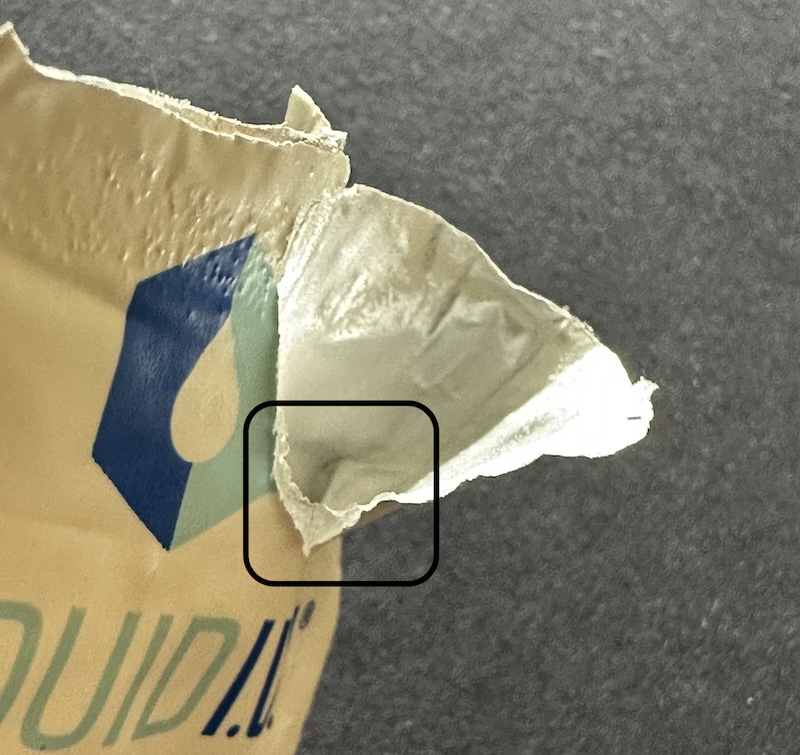
Most packets are composed of paper with a plastic lining. When tearing a packet open, you can see the plastic lining on the inside.
I have not been able to find reliable sources about the life cycle of these types of packets or details on their composition. It is clear however, that although there is some plastic it is minuscule in comparison to single-use bottles.
Recommendations for Hydration Brands
All brands deliver a similar mixture of salts and sugars in slightly different recipes (LMNT is and exception as it’s sugar free). Here are some recommendations based on common preferences:
Now that we’ve seen the ingredients for the leading hydration brands, making your own doesn’t seem too challenging. There are a host of recipes and how-to videos on the subject that will be able to guide you down this path much better than I can.
The more ingredients you can find that don’t require plastic packaging, the better! If you’re able to create your own hydration drink without the use of plastic packaging along the way, let us know how you did it in the comments.
Strategy 3: Taper To Alternative
Reducing the amount of sports drinks you consume might be the best strategy if you’ve developed a habit of grabbing a sports drink even when you don’t need it. Most of the time we think we need an electrolyte drink, we don’t.
Hydration drinks are recommended by most doctors only when signs of electrolyte imbalance start to occur or during extended and extraneous exercise when an imbalance is likely to occur. For most of us, this is a rare occasion. You can learn more about symptoms of electrolyte imbalance and alternatives to electrolyte drinks from the experts at Scripps.
I used to have the habit of grabbing a sports drink in lieu of water. After learning this was unnecessary and significantly increasing my sugar intake, I kicked the habit the same way I overcame my morning caffein addiction: a slow wean.
Here’s a simple plan that can help guide you through the process of breaking the sports-drink habit with little to no discomfort:
General Guidelines To Keep In Mind
Slow and Steady – Each week you should only be able to notice a very slight difference in the taste of your sports drink.
Consistency is Key – If you feel a strong urge for a sports drink or that the diluted version is too weak, adjust the timing and dilution accordingly. If you slip up a day or two, don’t worry about it. Just get back to your normal schedule.
Tracking is Half The Battle – The tracking may seem like a small piece but is actually critical. I have tracked many of my own habits over the years. The act of simply writing down each time I take a certain action I’m trying to adjust makes me more aware of it which is at least half the battle.
Celebrate The Wins – You can track the amount of sugar you’re taking out of your diet and the amount of money you’re saving… then celebrate them! I’ve found that taking a moment to congratulate myself after hitting a milestone boosts my motivation considerably.
Substitutions and Adjustments – You may also want to experiment with some ingredients from Strategy 2, or even a dash of lemon juice to help make plain water not feel so boring. Tweak the regimen to fit your needs and to optimize for your desired outcome.
Week 1-2: Initial Dilution
Baseline Measurement: Start by measuring how much sports drink you consume daily. A notebook or the Notes app on your phone should suffice.
Initial Dilution: Replace 25% of your sports drink with water. For example, if you drink 4 cups of sports drink daily, replace 1 cup with water. If drinking from a bottle, pour a 1/4 into another container and then fill the rest with water. If using a mix, just use 3/4 of what you would normally use.
Week 3-4: Increased Dilution
Increased Water Ratio: Now, replace 50% of the sports drink with water.
Taste Adjustment: Your taste buds will begin adjusting to less sweetness. Stay attentive to how your body feels with this change. You can adjust up or down a little bit accordingly. The key is to make the change slight, so it’s easy to manage and you can keep your streak going.
Week 5-6: Further Reduction
Majority Water: Increase the water content to 75%, reducing the sports drink to just a quarter of your intake. At this point you should be adding sports drink to water instead of the other way around.
Progress Check: You’re drinking half as much sugar and you’re probably noticing that you aren’t any less hydrated and may actually feel better.
Week 7-8: Nearly There
Minimal Sports Drink: Reduce the sports drink to just a small splash, about 10% of your drink, with the rest being water. You may even be able to use a substitute at this stage like a dash of lemon juice.
Observe Changes: Notice any changes in your energy levels or how you feel overall. This can be motivating.
Week 9+: Transition to Water
Complete Transition: Now, switch entirely to water.
Flavor Alternatives: If you miss the flavor, consider adding natural flavors to your water, like a slice of lemon, cucumber, or mint leaves.
Additional Tips:
Track Your Progress: Keep a journal or use an app to track your daily intake and progress. This helps with awareness of your intake and motivation as you can look back and see how much sugar (and plastic) you’ve cut out of your diet.
Mindful Drinking: Going forward, be conscious of why you’re drinking sports drinks (for taste, habit, energy) and how water can be a healthier alternative.
Next Steps
If this guide has helped you to reduce your plastic use, let us know about it by commenting here or sending us a note on one of our social media channels.
AND if you have additional recommendations related to this topic, let us know so we can share with the community. Thanks!
How does the number of times I use a water bottle change its environmental impact?
Video Highlights: Understanding the Environmental Impact of Water Bottles: A Deep Dive into Reusables vs. Single-Use
Introduction In this video I dive into the environmental impacts of water bottles, focusing on the comparison between reusable and single-use bottles. I explore several key factors that influence their overall environmental footprint, such as global warming potential, production costs, and usage patterns.
Main Points of the Video
The Impact of Reusability (00:00 – 00:30)
I explain how the number of times a reusable water bottle is used significantly reduces its global warming potential and environmental impact. This aspect is crucial in understanding the sustainability of water bottles.
Breakeven Point of Reusables vs. Single-Use (00:30 – 01:00)
The concept of the ‘breakeven point’ is critical. This is the number of uses a reusable bottle needs to surpass to become more eco-friendly than a single-use bottle.
Production Phase and Its Impact (01:00 – 01:30)
I highlight that the production phase of water bottles, whether single-use or reusable, contributes significantly to their environmental impact. This phase includes the resources used, manufacturing, packaging, and delivery.
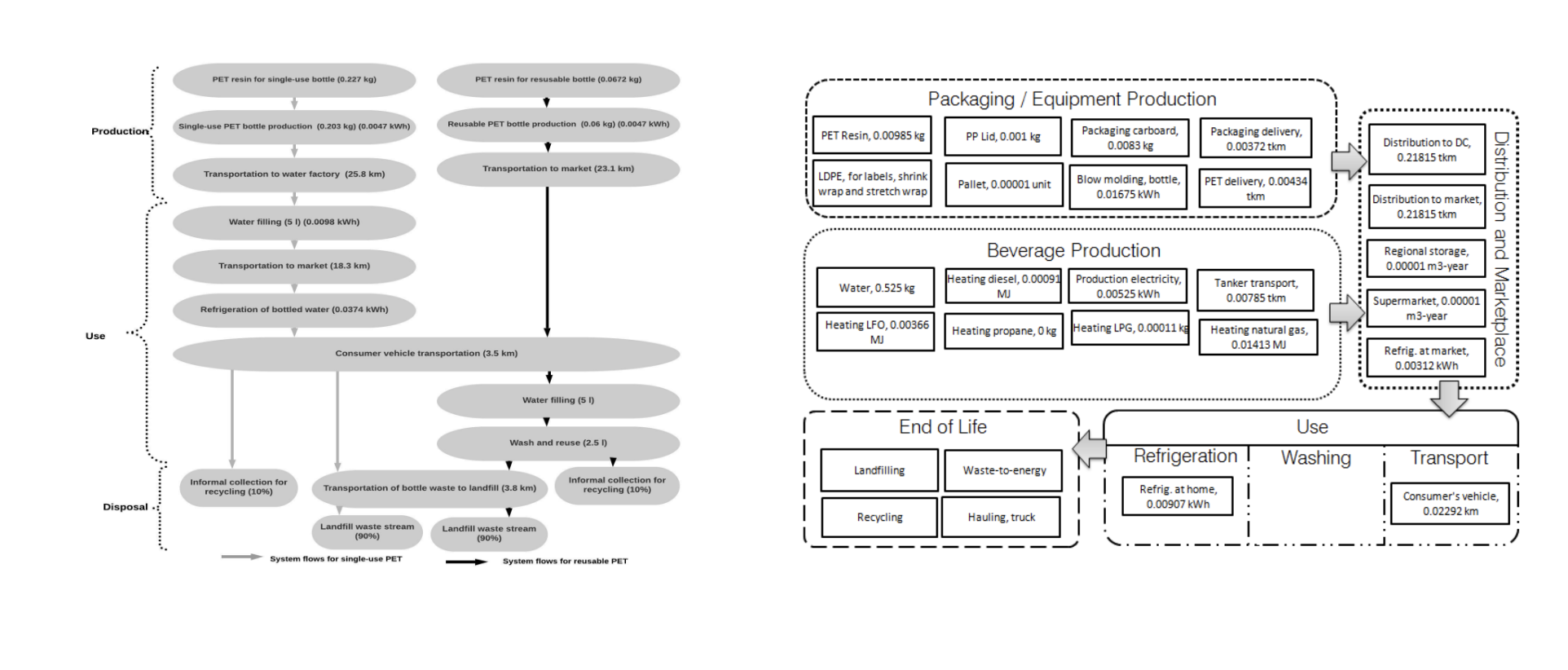
Lifecycle Analysis of Water Bottles (01:30 – 02:00)
The lifecycle analysis of water bottles is broken down into three main phases: production, use, and post-use (or disposal). Each phase has a varying impact on the bottle’s overall environmental footprint.
Global Warming Potential of Different Materials (02:00 – 02:30)
I discuss how different materials (glass, aluminum, plastic, steel) used in water bottles have distinct global warming potentials and environmental impacts, which change with the frequency of use.
Practical Implications and Consumer Choices (02:30 – 03:00)
I emphasize the practical implications of these findings for consumers. Choosing to reuse a water bottle, whether it’s a specifically designed reusable or even a single-use bottle, can significantly reduce environmental impact.
This video explains the life cycle analysis (LCA) of water bottles, focusing on the three main phases: production, use, and end-of-life.
Key moments with timestamps:
0:00-1:00: Introduction to LCA and the three phases for water bottles.
1:00-2:30: Breakdown of the production phase, highlighting its significant impact and various data inputs like resource extraction, manufacturing, packaging, and beverage production.
2:30-3:30: Explanation of the use phase for single-use water bottles, including transportation, washing, and refrigeration.
3:30-4:30: Comparison of the use phase for single-use and reusable water bottles, emphasizing the longer use cycle and additional washing factor for reusables.
4:30-5:30: Discussion of the end-of-life phase and its dependence on disposal methods like recycling or landfilling.
5:30-6:30: Comparison of the life cycle of single-use and reusable water bottles using a diagram, showcasing the significant impact of the production phase for both.
Additional details:
The video mentions that most of the impact for water bottles comes from the production phase.
The use phase for single-use water bottles is relatively low compared to production.
The life cycle analysis of reusable water bottles includes factors like the number of uses and the source of water.
Different studies may have different assumptions and scenarios, leading to variations in the results.
Data Sources
[1] Environmental Life Cycle Assessment of Drinking Water Alternatives and Consumer Beverage Consumption in North America (Access)
[2] Life cycle assessment of single-use and reusable plastic bottles in the city of Johannesburg (Access)
Olatayo KI, Mativenga PT, Marnewick AL. Life cycle assessment of single-use and reusable plastic bottles in the city of Johannesburg. S Afr J Sci. 2021;117(11/12), Art. #8908. https://doi.org/10.17159/ sajs.2021/8908
[3] Reusable vs Single-Use Packaging: A Review of Environmental Impacts (Access)
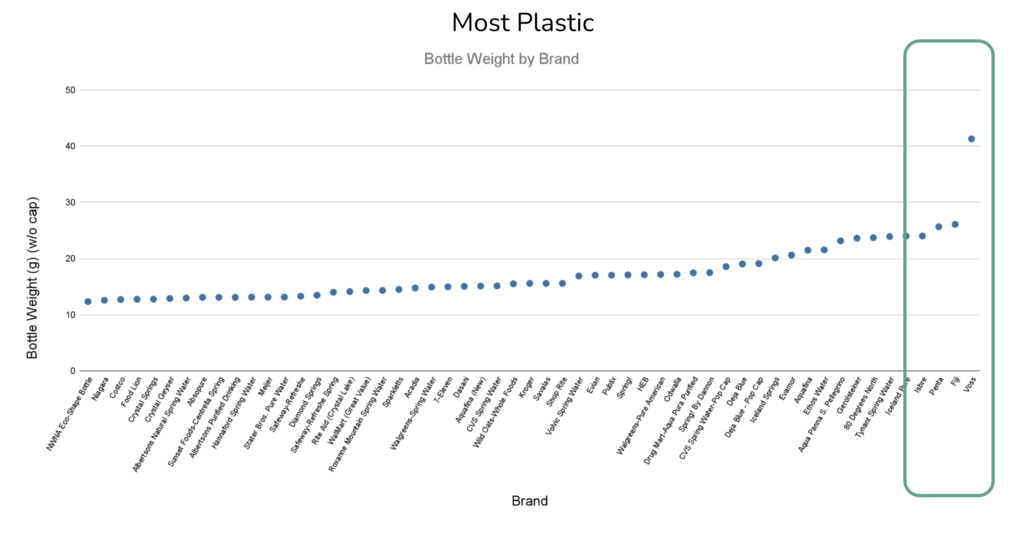
Single-Use Plastic Bottles Ranked by Plastic Content
Graph of Brands & Plastic Content
Table of Brands & Plastic Content
This table shows the data used for the graph above. It shows each brand and the plastic content for its 500mL bottle in grams. The cap is excluded from the weight. The bottles are weighed without water.
The average weight from this group of water bottles is 17.7g. The Difference from Avg. column shows how much more or less plastic the brand’s bottle has in comparison to the average.
Brand
Bottle Weight (g) (w/o cap)
Difference from Avg.
Nestle Eco-Shape Bottle
12.37
-30%
Niagara
12.6
-29%
Costco
12.73
-28%
Food Lion
12.77
-28%
Crystal Springs
12.79
-28%
Crystal Geyser
12.91
-27%
Albertsons Natural Spring Water
12.99
-27%
Absopure
13.11
-26%
Sunset Foods-Centrella Spring
13.11
-26%
Albertsons Purified Drinking Water
13.12
-26%
Hannaford Spring Water
13.15
-26%
Meijer
13.15
-26%
Stater Bros. Pure Water
13.16
-26%
Safeway-Refreshe
13.31
-25%
Diamond Springs
13.5
-24%
Safeway-Refreshe Spring Water
14.02
-21%
Rite Aid (Crystal Lake)
14.14
-20%
WalMart (Great Value)
14.32
-19%
Roxanne Mountain Spring Water
14.35
-19%
Sparkletts
14.52
-18%
Acadia
14.78
-16%
Walgreens-Spring Water
14.94
-16%
7-Eleven
14.98
-15%
Dasani
15.07
-15%
Aquafina (New)
15.12
-15%
CVS Spring Water
15.15
-14%
Wild Oats-Whole Foods
15.52
-12%
Kroger
15.59
-12%
Savalas
15.59
-12%
Shop Rite
15.59
-12%
Volvic Spring Water
16.91
-4%
Evian
17.05
-4%
Publix
17.06
-4%
Spring!
17.11
-3%
HEB
17.12
-3%
Walgreens-Pure American
17.18
-3%
Odwalla
17.21
-3%
Drug Mart-Aqua Pura Purified Water
17.47
-1%
Spring! By Dannon
17.52
-1%
CVS Spring Water-Pop Cap
18.58
5%
Deja Blue
19.05
8%
Deja Blue – Pop Cap
19.12
8%
Iceland Springs
20.13
14%
Evamor
20.63
17%
Aquafina
21.5
21%
Ethos Water
21.56
22%
Aqua Panna S. Pellegrino
23.16
31%
Gerolsteiner
23.64
34%
80 Degrees North
23.72
34%
Tynant Spring Water
23.94
35%
Iceland Pure
24
36%
Isbre
24.03
36%
Penta
25.68
45%
Fiji
26.1
47%
Voss
41.3
133%
About This Data
Our investigation was based on a life cycle assessment study that included data for the weights of various 500ml water bottles from a wide selection of brands. This method provided a clear picture of the plastic content in these ubiquitous products.
Results
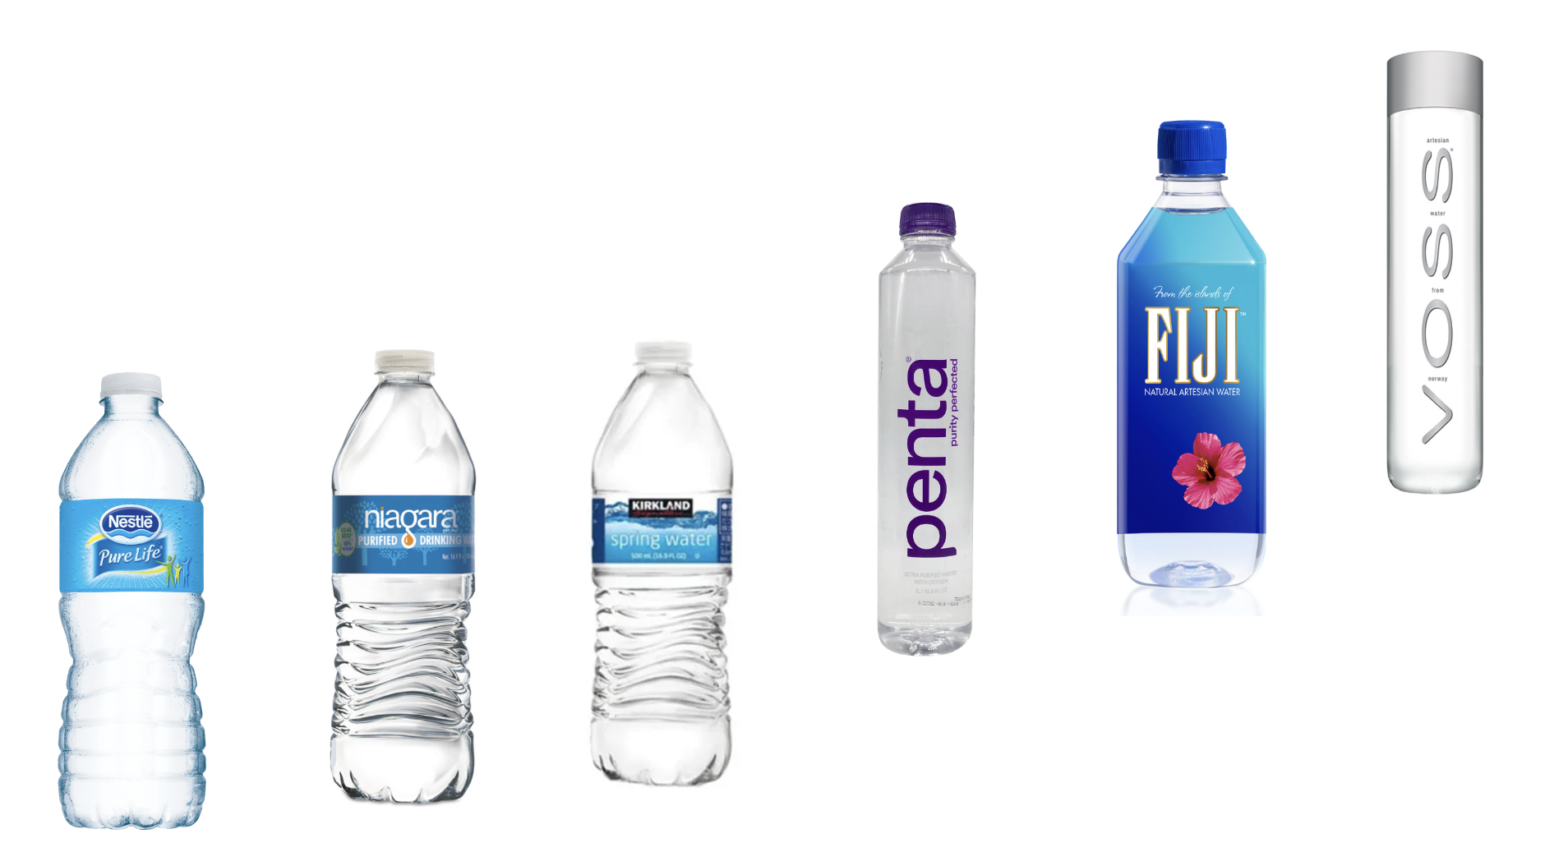
On average, a water bottle, sans cap and water, weighs about 17.7 grams. However, there’s significant variation among brands, with weights ranging from 12 to 41 grams.
The single use bottles with the most plastic content were Fiji, Voss, and Penta. Voss stood out, containing more than double the average bottle’s plastic. Fiji and Penta were also high on the list, with 47% and 45% more plastic than the average bottle, respectively.
What The Data Does Not Include
The data does not include every water bottle brand on the market and therefore is not exhaustive, but does give us an interesting look into the landscape.
The data also doesn’t account for bottles using recycled plastic content. We are looking into this and will follow up with another post that takes this into consideration.
DataSource:
Environmental Life Cycle Assessment of Drinking Water Alternatives and Consumer Beverage Consumption in North America (Access)
About The Report: This is the most comprehensive and relevant life cycle analysis study on topic we’ve been able to find. While it was commissioned by Nestle Waters North America, it was done so with a stated mission to understand how to reduce their environmental footprint, is clear about the intentions of the project, and was reviewed by a panel of experts outside Quantis (the team commissioned for the study).
Will a reusable water bottle lower your environmental footprint?
In this post I will answer three main questions:
How can we compare the environmental impact of one bottle vs another?
How many times do I need to use a reusable bottle before it becomes more environmentally friendly than a single-use water bottle (the breakeven point)?
What are the breakeven points for popular reusable water bottles like Nalgene and Hydro Flask?
The basics of comparing single-use vs reusable water bottles
Before answering any questions it’s important to have context around this question of disposable vs reusable. Varying opinions on whether single-use bottles are worse or better for the environment than reusable alternatives stem from unfair comparisons.
A few reasons why people may be comparing apples to oranges:
Types – different types of single-use bottles have varying impacts. There are many variations of water bottles from their composition to the source of water they hold. There is even more variation in reusable bottles, material being a key variable. This makes it difficult to make blanket statements like “all single-use water bottles are worse than reusable alternatives”.
Focus – depending on which aspect of environmental impact you’re focusing on, the results can vary. Energy use, natural resource use, pollution, and emissions, are just a few of the different areas you can compare. To understand the full cost, you have to consider the complete environmental impact of single-use vs reusable, not just one aspect.
Other – Other variables such as the technology used to manufacture the bottle or how far it traveled to get the point of sale also changes the environmental impact.
They key indicators of environmental impact
These are the main 3 areas used to evaluate the life cycle of water bottles and some considerations to keep in mind for each:
Production – What is the impact of manufacturing one bottle
Natural resource extraction
Energy use in attaining resources and manufacturing
Transportation of resources and components or final products
Use – How use of the product impacts humans or the environment
Environmental impact of use
Lifespan of the product
Post Use – How disposal of the product impacts the environment
Pollution of natural environment
Emissions from disposal (gasses from breakdown in landfill or incineration)
Cost of recycling
The total impact of a product can be calculated using our simplified formula:
Total Environmental Impact = Cost of Production + Cost of Use + Cost of Disposal
The process of calculating the total impact of a product is called a Life Cycle Analysis (LCA). In our research we look for LCAs and peer-reviewed papers that have calculated the impact of single-use bottles vs reusable alternatives.
The hot button environmental issues for water bottles
The most common types of environmental impact from water bottles include:
Emissions – global warming, air pollution
Natural Resource Use – deforestation, biodiversity loss, global warming
Pollution – biodiversity loss, degradation of natural environment
Some people may weight one factor as more important than another depending on their opinions of which environmental issue is most pressing.
The most common comparison for environmental impact is the product’s overall ‘carbon footprint’ which measures how much it contributes to global warming. The common metric used is Global Warming Potential (GWP) which is measured in kilograms of carbon dioxide equivalent (kg CO2 eq). This common metric allows us to compare various product types under the same metric and its what we’ve used to calculate breakeven points. A product with higher GWP, or more kg CO2 eq, is worse for the environment.
Breakeven Uses: When does a reusable water bottle become more environmentally friendly than a single-use bottle?
Depending on the composition of a reusable bottle, it can take between 2 and 90 uses before it becomes more eco friendly than a single-use water bottle. The table below shows this breakeven point for reusable water bottles by material. Below the table we’ve explained each range and the data behind them.
Breakeven Range: The number of times a bottle needs to be used in lieu of a single-use bottle before it has a lower Global Warming Potential than a single-use bottle. Comparison is to a conventional .5L (16.9oz) single-use bottle.
Reusable Bottle Material
Breakeven Range (Number of Uses)
Glass
2-6
Plastic (PET)
10-30
Aluminum
10-30
Stainless Steel (Non-Insulated)
10-30
Stainless Steel (Insulated)
30-90
Table 1: Number of uses a reusable bottle of the material indicated needs to be used to be more eco friendly than a conventional plastic water bottle.
Breakeven Estimates for Popular Bottle Types
Here are our best estimates for the breakeven points for the most popular types of reusable bottles organized by material type:
Plastics: Nalgene, Cambelbak, Etc.
Reusable water bottles made of PET plastic or similar variants such as Nalgene and Camelbak will be more sustainable than a single-use plastic water bottle after 10-30 uses.
Our Research: The input materials for all 3 variations of plastic listed here are very similar. The breakeven points for all of these materials are very similar.
Copolyesters – This is a variation of PET. The most relevant use in this context is Tritan plastic which is used in most modern Nalgene and Camelbak water bottles.
Polycarbonate – Plastic that is used in older generation Nalgene bottles, and still in some other brands.
PET – This is what most single-use bottles are made from and some reusable bottles are made with more, thicker, PET.
Data Sources: [1][2]
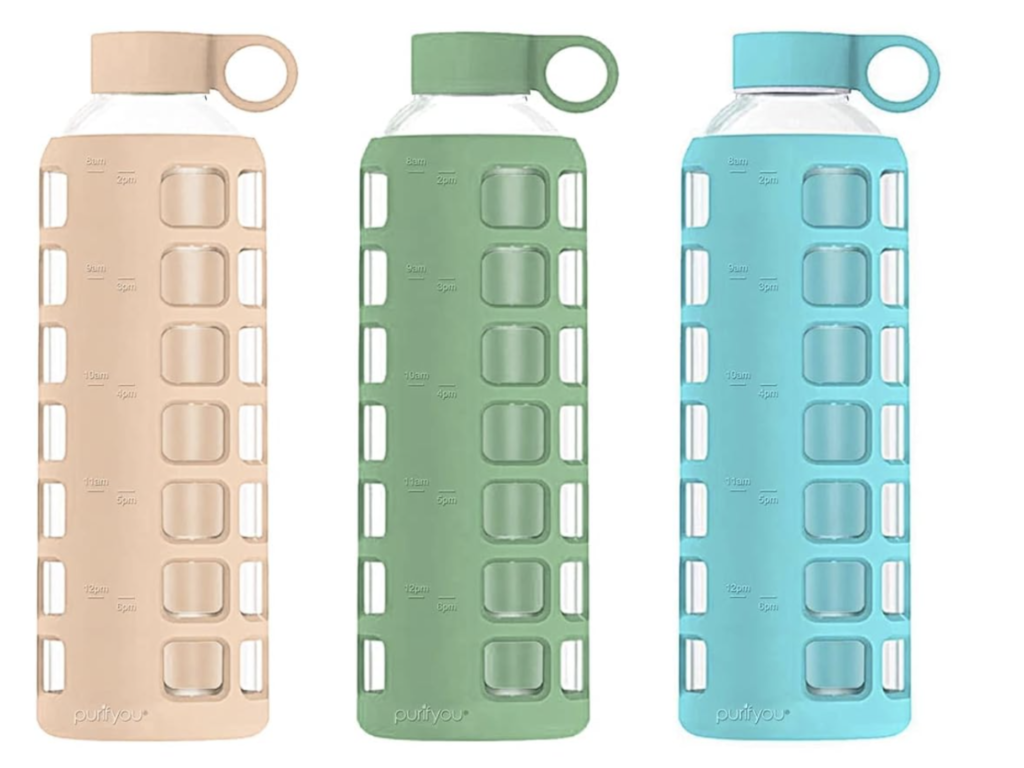
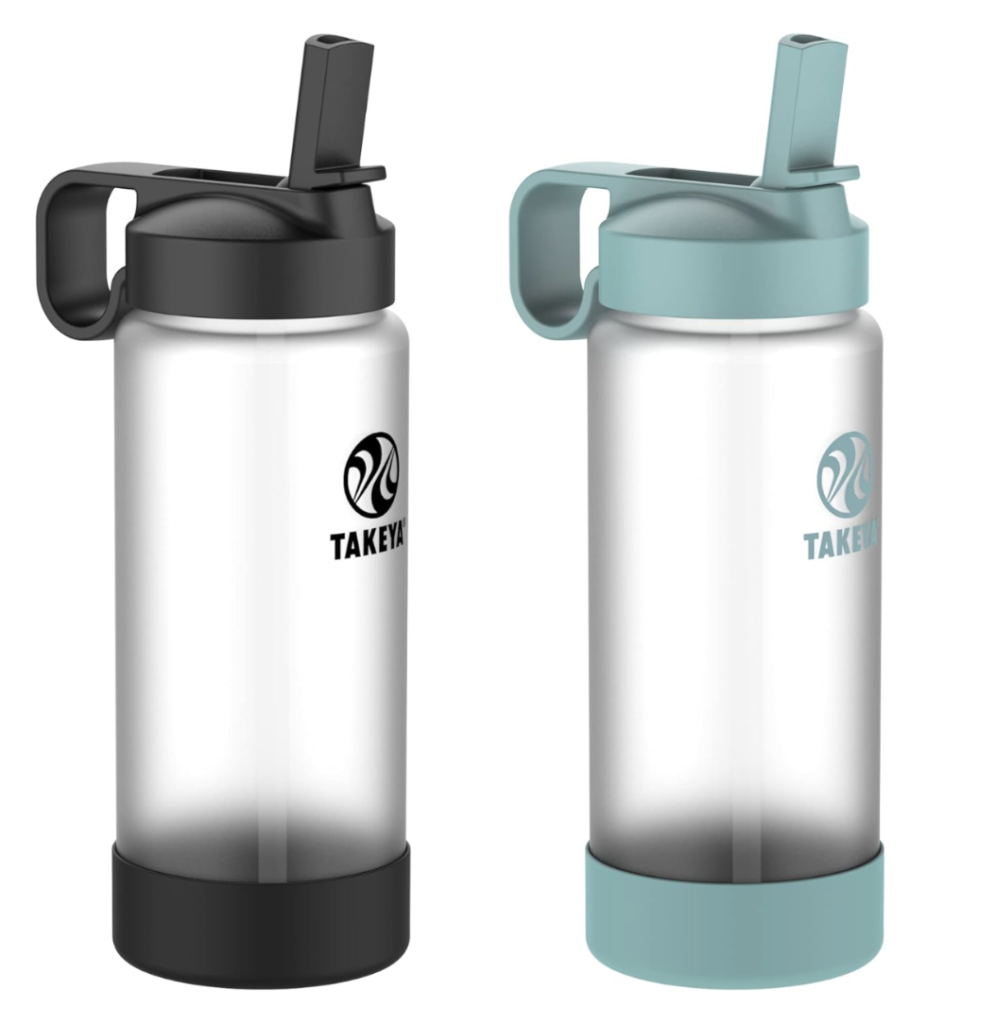
Glass: purifyou, Takeya, Etc.
Most reusable glass water bottles will be more sustainable than single-use plastic bottles after only 2-6 uses. Most brands have a silicone sleeve and plastic top which will increase the breakeven point.
Glass Content – More glass will impact the GWP of a bottle but can also contribute to a longer lifespan, allowing for more uses.
Caps – Account for a small portion of the bottle’s footprint; 10% or less. [1]
Sleeves – We haven’t been able to find reputable literature regarding silicone sleeve’s contribution to a glass bottle’s GWP. To be cautious we have extended the breakeven range from 2-3 to 2-6 and will update our findings when reliable research is published.
Our Research: Multiple LCA research papers using various methods estimate glass bottles to be at a breakeven point of 2-3 uses. [4]
Stainless Steel:
Non-Insulated stainless steel bottles such as Bambaw and Nalgene will be more sustainable than single-use water bottles after about 10-30 uses. This is a wide variation because there are several unknowns about this new type of bottle.
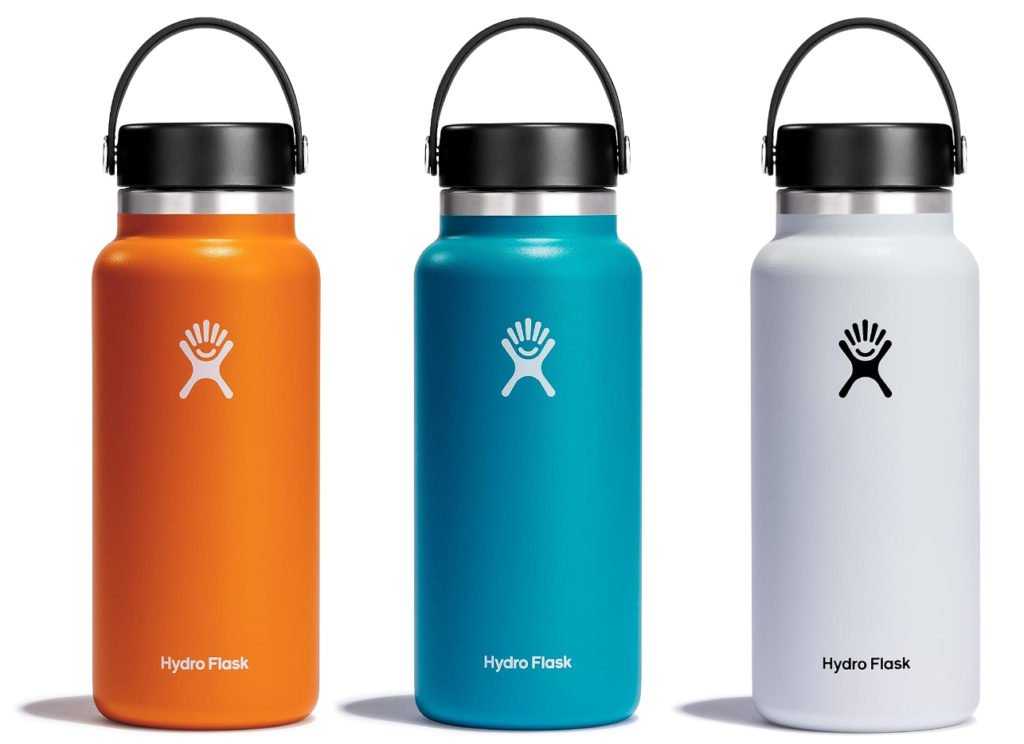
Insulated stainless steel bottles such as Hydro Flask and Camelbak have a higher production cost which drives up their breakeven point to around 30-90. Insulated bottles have a design consisting of two layers of steel and a vacuum air insulation between the two levels. For manufacturing this means:
More Materials – insulated steel bottles have about 3 times as much stainless steel as non-insulated bottles.
More Energy – the manufacturing process is more involved, requiring more energy input.
Our Research: The breakeven point for stainless steel bottles was evaluated in the context of virgin stainless steel vs the Nestle Ecoshape Bottle. The Ecoshape bottle uses less plastic than a conventional single-use plastic water bottle. Given this, we can assume the breakeven point stated in this analysis (~10 uses) is higher than it would be in comparison to average water bottles so its safe to assume this is at the lower end of the range.[1]
Our Research: The breakeven point for Aluminum was evaluated in the context of virgin aluminum vs the Nestle Ecoshape Bottle. The Ecoshape bottle uses less plastic than a conventional single-use plastic water bottle. Given this, we can assume the breakeven point stated in this analysis (~12 uses) is higher than it would be in comparison to average water bottles so its safe to assume 12 uses is at the lower end of the range.[1]
Other Variables To Consider
The production phase of a water bottle accounts for the biggest portion of its footprint and is comprised of resource input and manufacturing. Understanding the Global Warming Potential in this stage will provide a reasonable estimate for comparing bottle types and determining ranges for breakeven points.
Production accounts for the majority of GWP within the life cycle of bottles.
The additional aspects listed here can shift the sustainability of a bottle, but are not nearly as big of a factor as the production phase.
Recycled Material
Some materials are more recyclable than others. This table shows the difference in recyclability between materials commonly used for reusable water bottles. Some key takeaways include:
Aluminum is the most energy efficient to recycle. It has a high energy savings and low recycling complexity.
Glass, Aluminum, and Stainless Steel can all be recycled again and again without degradation, while most plastics can only be recycled a limited number of times.
Material
Recyclable
Recycling Efficiency
Energy Savings from Recycling
Recycling Process Complexity
Degradation on Recycling
Glass
Yes
High
30-50%
Moderate
No
Aluminum
Yes
Very High
95%
Low
No
Plastic (PET)
Yes
Moderate
70-80%
High
Yes
Stainless Steel
Yes
High
60-70%
Moderate
No
Table 2: Comparing recyclability of materials commonly used for reusable water bottles.
In Production – Recycled Content
The energy required to manufacture water bottles is much higher when the materials are extracted from natural resources rather than from recycled sources. For all bottle types, the more recycled material incorporated into production, the lower its environmental impact. The more recycled material that is used for a reusable water bottle, the lower its breakeven point against single-use bottles will be.
In Post Life – Recycling of Used Bottles
If a bottle can be collected and recycled, its footprint drops significantly. The challenges we’ve found in our research regarding recycling:
Only a small portion of bottles that are recyclable actually get recycled. A Greenpeace report from 2022 found that only 5% of plastics in the US are being recycled.
There is an energy cost to collect and recycle items. This can vary widely depending on distances traveled and energy sources for collection and recycling.
Infrastructure for recycling remains relatively low. Companies like Nalgene, CamelBak, and Hydro Flask have collection and recycling programs for their products.
Sourcing
While the production phase of a bottle accounts for the majority of its footprint, distance to market and the source of the water it holds are considerable factors. This is mainly a factor for single-use bottles. Reusable bottles are generally filled with tap or filtered water near the source of consumption.
Distance To Market
If you’re in New York city, water bottled upstate will have a much lower footprint than Fiji Water… which is bottled in Fiji.
Illustration of distance between source of water and point of sale; example of Fiji water sold in New York.
The same applies for reusable water bottles. The further away your water bottle is manufactured, the bigger its footprint. This doesn’t have an outsized effect on the overall footprint for a few reasons:
Transportation to destination market is one of many factors (production being the biggest).
Bottles are generally being shipped in mass, which makes the overall emissions per individual bottle relatively low.
Reusable bottles are shipped empty from origin of manufacturer. Single use bottles are often shipped twice:
Once from manufacturer to the location where they will be filled.
From filling location to destination market.
These factors are addressed in almost every life cycle analysis study we reviewed. Here’s a common example showing how much transportation contributes to the overall GWP of reusable bottles.
The best rule of thumb, as you already know, is that local is better. The further a product has to travel to get to us, the larger its footprint will be.
Frequently Asked Questions
Which single-use water bottles have the most plastic?
Bottles with an “eco shape” which have thinner plastic walls are on the low side. Brands with thicker bottles are on the high side. In a study that evaluated 55 brands, Voss and Fiji bottles had the most plastic.
How is the life cycle of a single-use water bottle calculated?
A life cycle analysis (LCA) evaluates each aspect of the water bottle’s life. LCAs are usually grouped into three phases:
Production
Use
Post Use (Disposal)
Each phase is broken down into the smallest individual part and the best possible estimate for each part is researched. The sum of these parts is collected to evaluate the full life cycle. See a full explanation in our video here.
How does the number of times I use a water bottle change its environmental impact?
The more times you use a water bottle, the lower its Global Warming Potential (GWP) will be. This is because the reusable bottle’s impact in the production phase is distributed across the life of the product.
[1] Environmental Life Cycle Assessment of Drinking Water Alternatives and Consumer Beverage Consumption in North America (Access)
About The Report: This is the most comprehensive and relevant life cycle analysis study on topic we’ve been able to find. While it was commissioned by Nestle Waters North America, it was done so with a stated mission to understand how to reduce their environmental footprint, is clear about the intentions of the project, and was reviewed by a panel of experts outside Quantis (the team commissioned for the study). The comparisons between the Global Warming Potential of single-use plastic bottles vs reusable alternatives is within the same range of other LCA studies we read.
The final report was published on Feb 1, 2010.
[2] Life cycle assessment of single-use and reusable plastic bottles in the city of Johannesburg (Access)
Olatayo KI, Mativenga PT, Marnewick AL. Life cycle assessment of single-use and reusable plastic bottles in the city of Johannesburg. S Afr J Sci. 2021;117(11/12), Art. #8908. https://doi.org/10.17159/ sajs.2021/8908
About The Report: This report is specific to the comparison of single-use and reusable PET bottles and is specific to Johannesburg, South Africa. It draws much of its data (like most studies we read) from other peer-reviewed studies and LCA databases. We evaluated the GWP of the production process of both bottle types to compare the impact and calculate the breakeven points. Our calculations and notes are available here.
Published in the African Journal of Science in 2021
[3] Reusable vs Single-Use Packaging: A Review of Environmental Impacts (Access)
About The Report: This report draws from various peer-reviewed studies to evaluate the sustainability of reusable vs single-use packaging. A key component they evaluated is water bottles. Where relevant and possible we went to the source research they referenced. We couldn’t access all studies referenced because some are behind pay walls. Those we were able to check were accurately referenced. The report was created by Reloop which states that it “works with governments, industry and society to accelerate the global transition to a circular economy for all resources”.
Published in 2020
[4] Sustainability of reusable packaging–Current situation and trends
P. M. Coelho, B. Corona, R. ten Klooster, and E. Worrell, “Sustainability of reusable packaging–Current situation and trends,” Resour. Conserv. Recycl. X, vol. 6, no. March, p. 100037, 2020.
About The Report: This meta analysis of various LCAs on glass bottles vs plastic bottles is referenced in several reports we read including the Reloop Report [3] and a report by NORSUS, The Norwegian Institute for Sustainability Research. The report concludes that across the board, research evaluated glass bottles to have a breakeven point of 2-3 uses vs plastic bottles.
A national online recycling directory for plastic bags and films has been taken offline, six months after an investigation by ABC News found some materials were ending up in landfills, incinerators and other waste facilities.
The directory previously directed users to some 18,000 store drop-off locations around the country where they could bring used plastic bags and packaging to be recycled, including Walmart and Target locations. The initiative was promoted by the US Environmental Protection Agency (EPA) and local and state governments across the country.
In May, ABC News and affiliates used digital tracking devices to monitor plastic waste dropped off at Walmart and Target stores listed on the directory. Of the 46 trackers placed, the vast majority never ended up at locations associated with plastic bag recycling.
“Plastic film recycling had been an abysmal failure for decades and it’s important that plastic companies stop lying to the public,” said Judith Enck, president of advocacy group Beyond Plastics. “Finally, the truth is coming out.”
Plastics are a major contributor to the climate crisis. Made from oil and gas, the materials are set to drive nearly half of oil demand growth by midcentury, according to the US International Energy Agency.
Producing the materials requires fossil fuel extraction, refining and “cracking” in special high-heat facilities, and plastic waste often ends up in landfills and waste incinerators. Each step produces planet-heating and toxic emissions.
Nina Bellucci Butler, CEO of Stina Inc, which managed the directory, cited a serious lack of commitment from industry partners in the decision to shutter the initiative, as well as meager demand for recycled plastics.
“It’s a fine line between maintaining a credible resource to help people find the best option for the common household items that are not easy to eliminate … and enabling greenwashing,” she wrote in an email.
She said a lack of adequate funding for the project and the plastic recycling sector at large also contributed to the decision to take down the site. The project was initially funded by the American Chemistry Council, a plastic industry lobbying group which has lobbied against many US environmental regulations, but Butler said it had been self-funded for almost a year before closing down last month.
The directory’s demise is indicative of a larger problem in the plastics recycling sector. Of the 51m tons of plastic waste US households generated in 2021, just 2.4m tons – or 5% – was recycled, a Greenpeace report found last year.
A major hurdle: plastic materials are expensive to collect and sort. There are thousands of different kinds of the material, and none of them can be melted down together. Even plastics of the same category often can’t be recycled together – bottles that are dyed green or blue, for instance, can’t be processed with clear bottles made of the same kind of plastic, and few facilities have the capacity to sort so many different materials, the Greenpeace report found.
Industry interests have long insisted that plastic recycling can be improved, yet report after report shows recycling is failing to rein in the problem.
Plastic waste is also a major contributor to terrestrial and marine pollution, and can leach toxins into the environment.
Experts say plastic production must be curbed in an effort to curb toxic and planet-heating pollution. And Enck, who is also a former Environmental Protection Agency regional administrator, said rather than relying on plastic recycling programs, “it’s better for people to shift to reusable bags”.
Butler said Stina also encourages the public to recycle plastic goods with the Trex Company, which still runs a recycling program with retailers. But ultimately, she said, she hopes the decision to end the program “results in more support for recyclers”.
“It’s past time to rethink business as usual,” she said.
Last month, world leaders met in Kenya to negotiate plans to tackle the plastic pollution crisis. And at the international climate talks known as Cop28 in the UAE this week, Inger Andersen, the executive director of the United Nations environment program, urged nations and plastic producers to change their behavior.
“The world is ready to break its addiction to both fossil fuels and plastics,” she said.
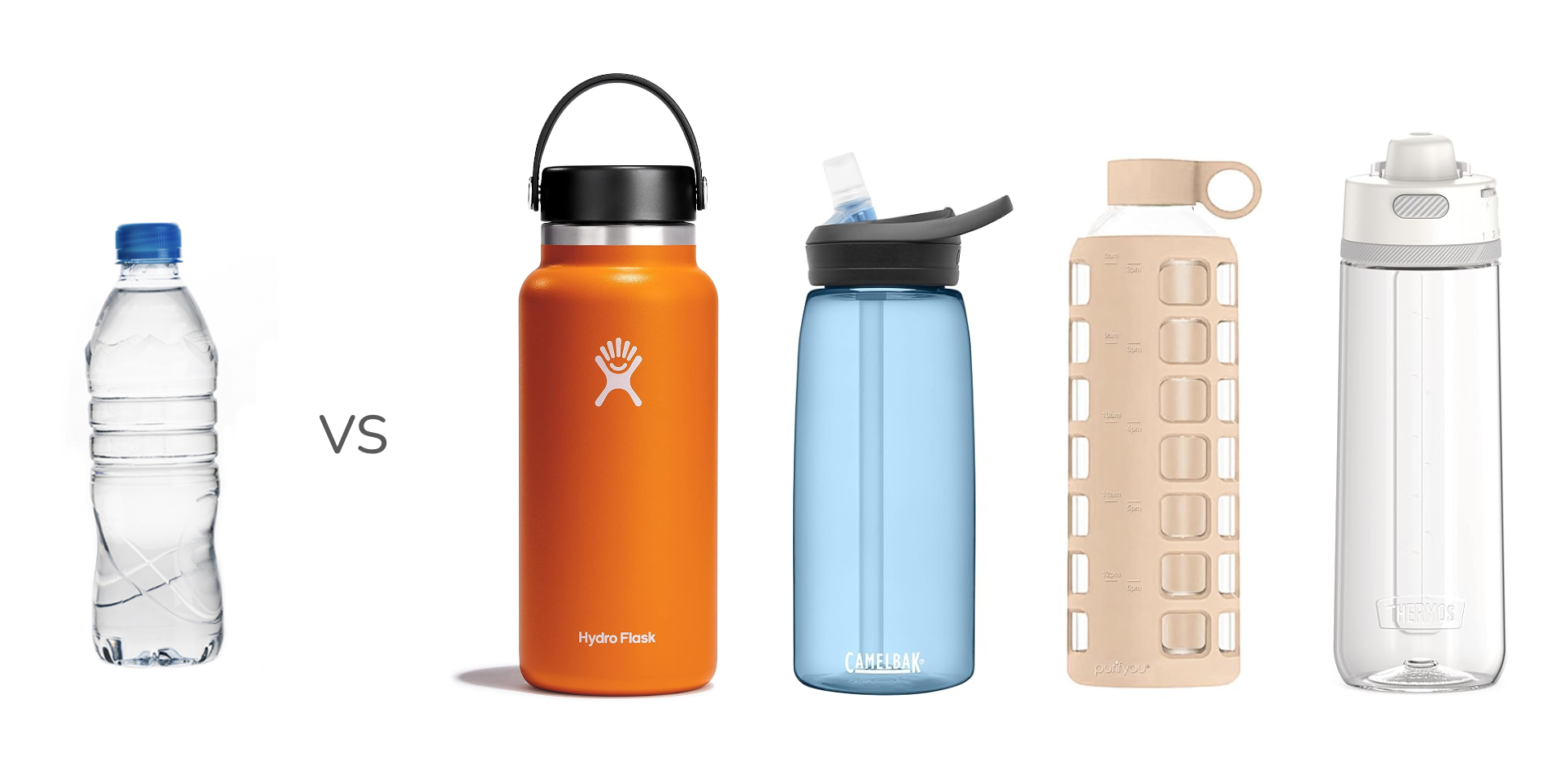
This guide will help you select a reusable water bottle that meets your needs and will enable you to reduce or eliminate the need for single-use plastic bottles.
Replacing Single-Use with Reusable
Single-use plastic bottles are the worst environmental offenders because they deliver so little utility for how high their environmental footprint is. The cost to create, fill, deliver, and dispose of one plastic bottle is tremendously expensive compared to the value it delivers (most people will consume 12oz of water in a couple of hours).
While reusable water bottles do come at a higher environmental cost to create on a per-bottle basis, they are much more sustainable than single-use bottles in the long run. Learn more about the breakeven point of the most common types of reusable water bottles vs single-use bottles here.
How To Select The Right Reusable Water Bottle
The number of uses is the biggest factor in how environmentally friendly a reusable water bottle can be. The more times you use it in lieu of a single-use water bottle, the more sustainable it becomes. So a good way to start deciding which bottle to buy is based on what you need it for. This will help you narrow down size and material. Then you can evaluate brands and costs.
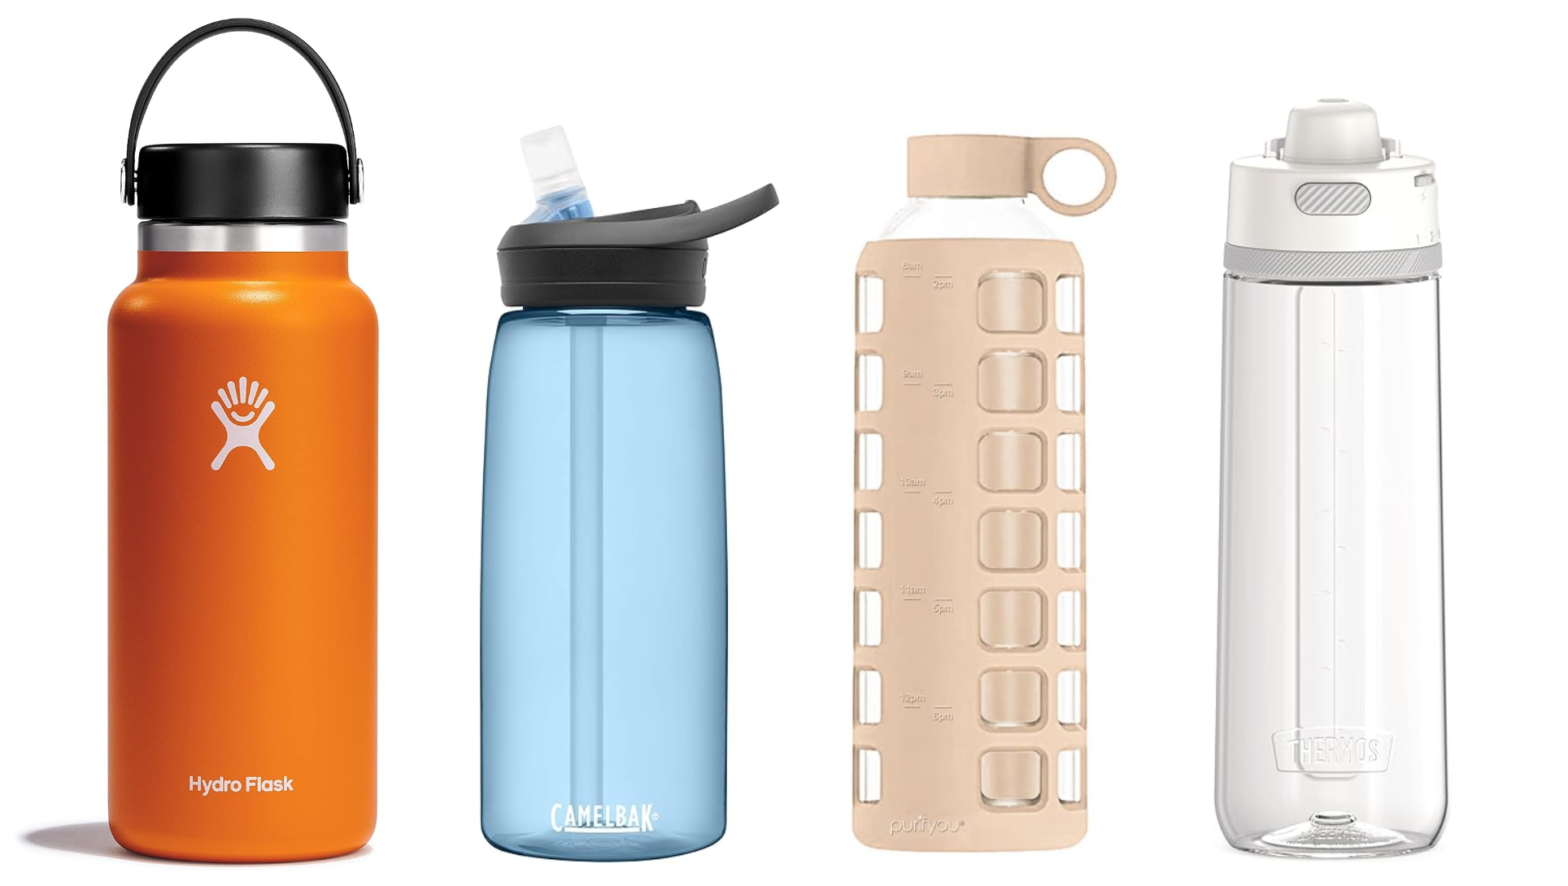
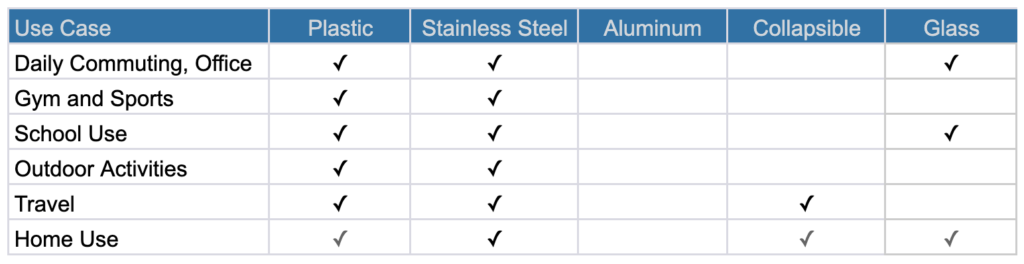
Here are the main use cases for reusable water bottles and the best type for each:
Daily Commuting and Office Use:
Best Type: Plastic, Stainless Steel, Glass
Why: Lightweight, easy to carry, and fits in car holders or bags. Doesn’t need to be high performance, just convenient.
Gym and Sports:
Best Type: Plastic (BPA-free), Stainless Steel
Why: Generally a more durable material will last longer. It’s also good to consider having a bottle with a wider mouth so it’s easier to clean if you’re going to be mixing anything like hydration mixes into your water.
School Use:
Best Type: Plastic, Stainless Steel
Why: Lightweight, durable, and often come in various designs.
Outdoor Activities (Hiking, Camping):
Best Type: Stainless Steel, or Plastic (BPA-free)
Why: Durable, can handle rough use, and good for temperature retention. In the case of hiking or camping, plastic is light-weight.
Travel:
Best Type: Plastic, Stainless Steel, Collapsible
Why: You still want a bottle that can withstand drops. If you’re going to be somewhere with reliable tap water and you don’t need to carry a full bottle to last you most of the day, than a collapsible bottle may be more convenient.
Home Use:
Best Type: Glass
Why: Chemical-free, doesn’t alter taste, good for repeated use, and is at low risk of breaking around the house.
All of the options recommended here are affordable and great alternatives to single-use water bottles. They are ranked by durability because the longer your bottle lasts, the more single-use plastic it can displace!
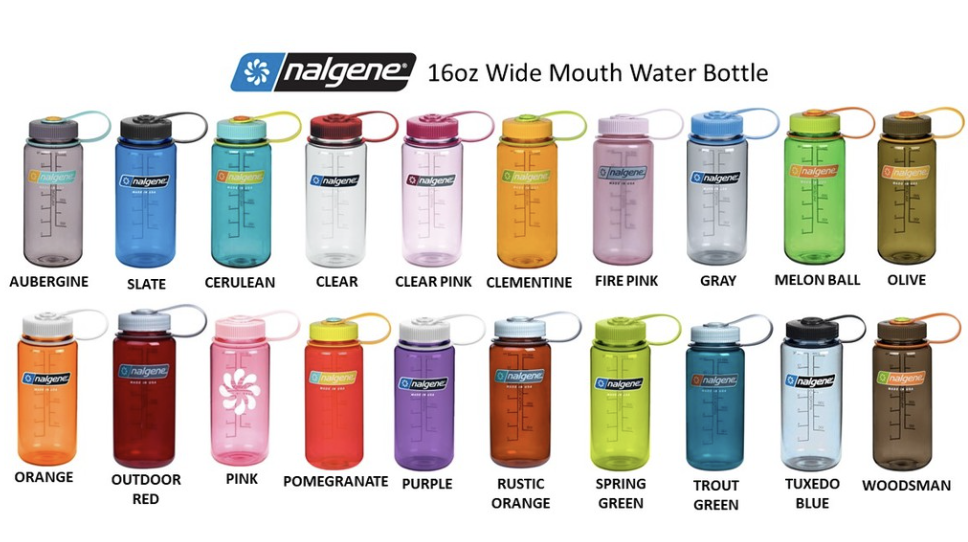
#1 Nalgene – Functional, durable, and simple water bottles
This line of water bottles is tried and true. They are extremely durable – I’ve tried to destroy one by running it over with a truck… and while it did eventually collapse I was impressed with how strong it was. They’re multi-functional, easy to clean, and the proprietary plastic used doesn’t pose health risks.
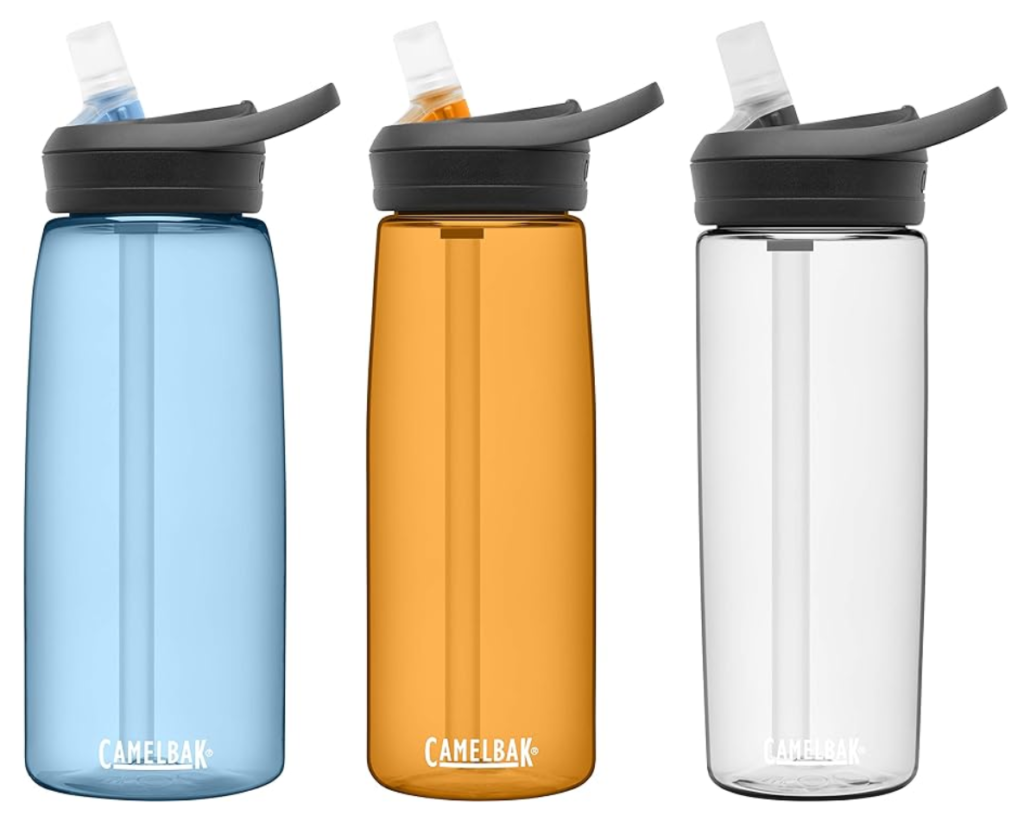
The straw makes it a little harder to clean, but it’s still simple and durable. If your preference is for a bottle with a straw, you can’t go wrong with a Camelbak.
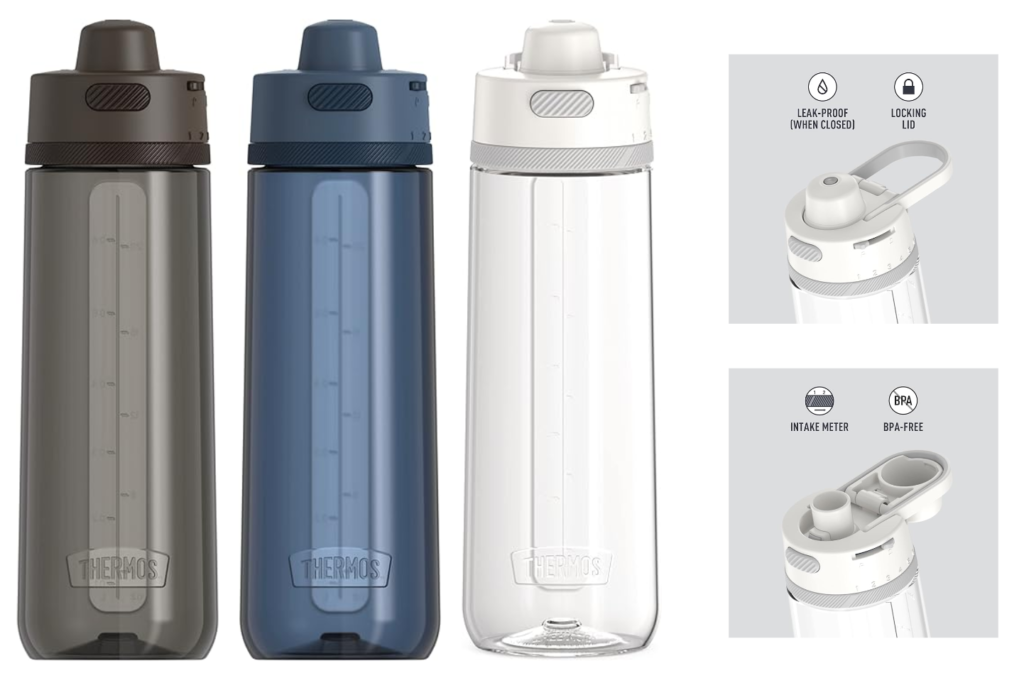
#3 Thermos – A little more functionality, a little less durable
If you prefer this style of bottle, Thermos is a good brand to go with. It’s ranked #3 only because with more moving pieces, it will be more likely to break and harder to clean, which may shorten the lifespan.
Hydro Flasks are simple, durable, and amazingly insulated. They keep cold drinks cold for 24hrs and hot drinks hot for 12hrs. I can attest to this and am continually amazed at how effective they are. Hydro Flask also offers a straw option if that’s your preference.
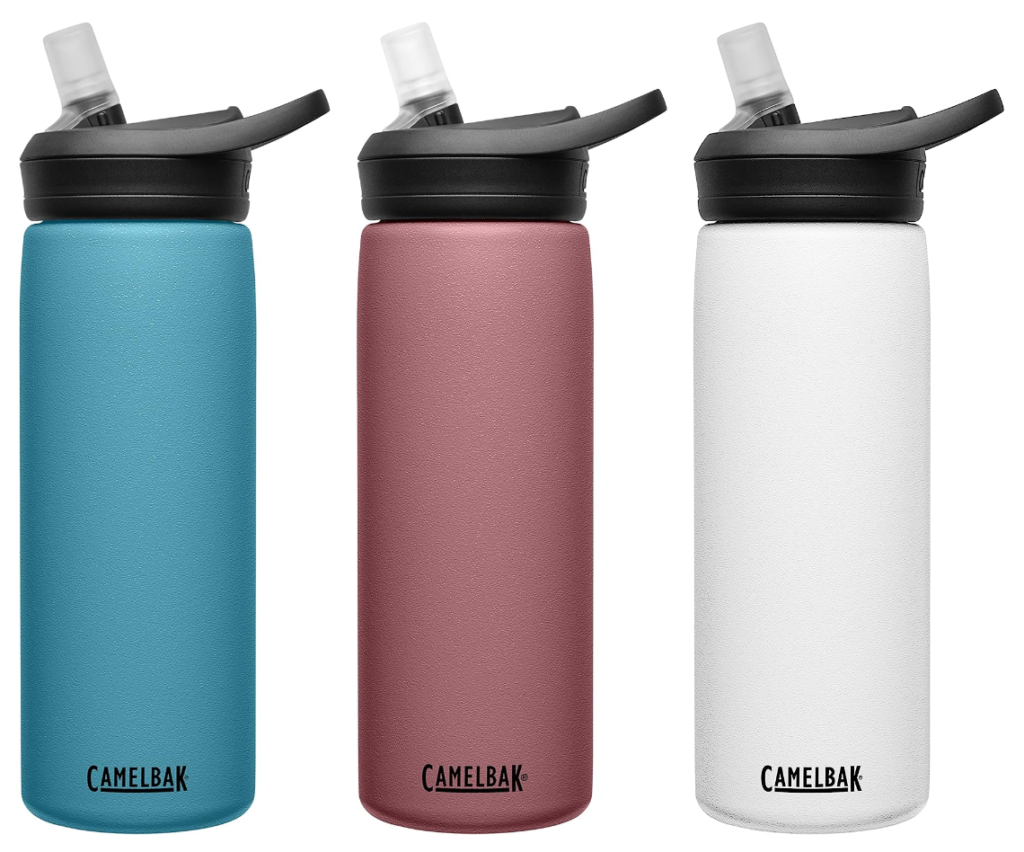
Camelbak’s bottles technically don’t insulate as well, but are still a great option. For most use cases this level of insulation should be plenty and user reviews attest to this. Check the bottle’s label to see how well they insulate:
“10 hours cold” – refrigerated water without ice stored in the product will still be cool for approximately 10 hours
“6 hours hot” – freshly brewed coffee or tea stored in the product will still be warm approximately 6 hours later
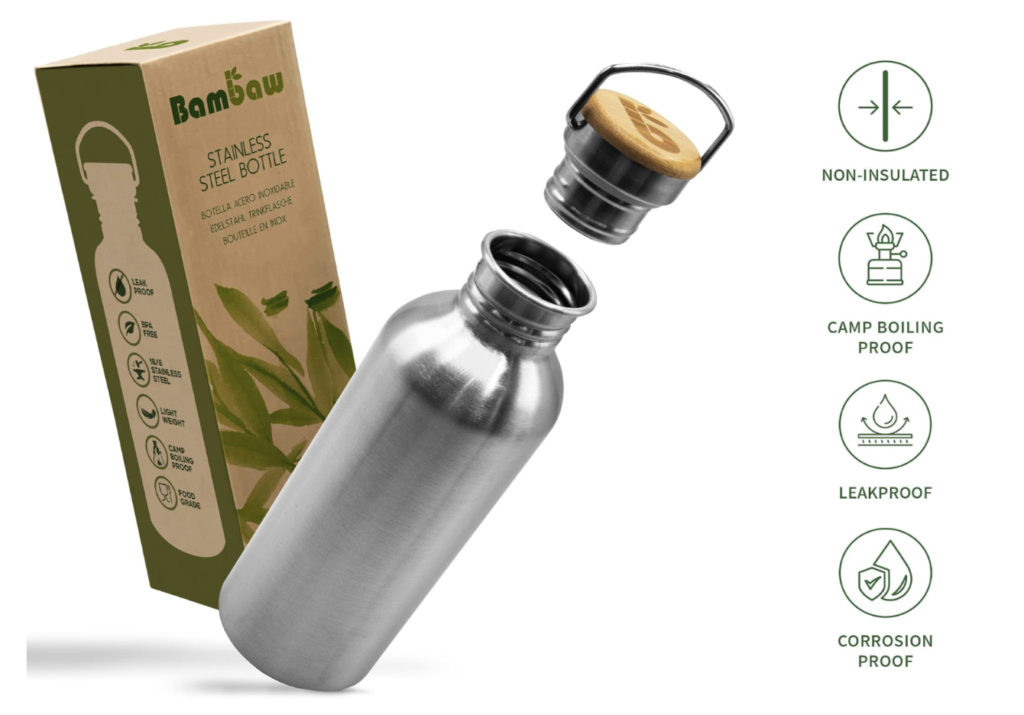
Non-Insulated
If you want the lowest-price and (generally) lowest carbon footprint bottle that is not plastic… a non-insulated stainless steel bottle is a good choice (see concerns about aluminum bottles below).
Insulation vs Non-Insulation?
Weight – Non-insulated bottles are a little bit lighter but not enough to truly notice, especially when you have it filled with water the majority of the time.
Size – They are also a little bit smaller since the walls are thinner, which may be a factor if you’re traveling, but generally not a significant concern for most people.
Price – When it comes to price however, there is a significant difference. Insulated bottles are generally twice as much as non-insulated bottles.
Carbon Footprint – Insulated bottles also require more materials and energy input to produce, so they have a bigger carbon footprint than non-insulated bottles.
Based on their product reviews, website, and reviews on third party environmental sites, Bambaw appears to be a reputable brand. They have a mission to provide environmentally friendly and healthy products. If I was looking for a non-insulated bottle, this would likely be my selection.
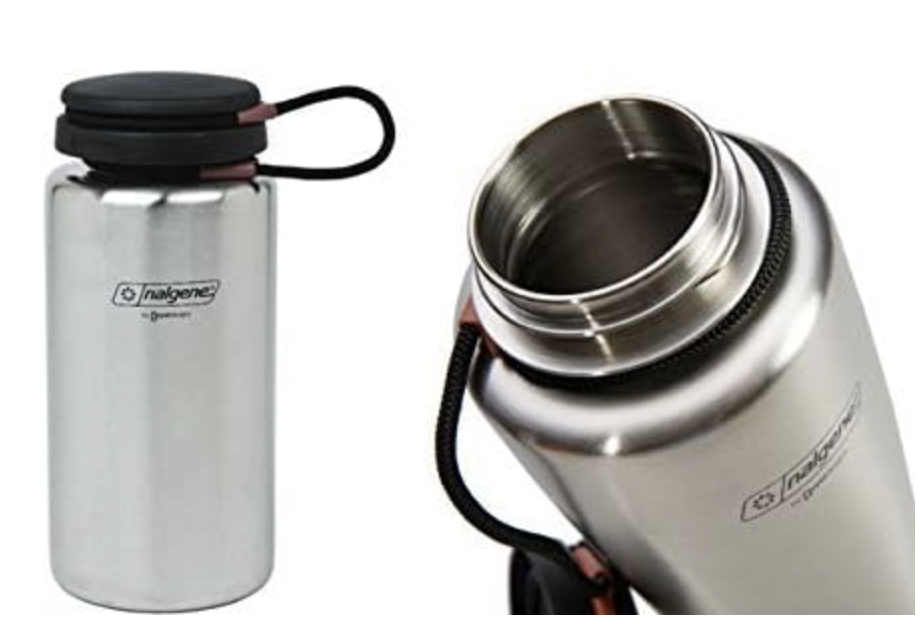
I like the Nalgene stainless steel bottle because it has a wide mouth which is easier to clean. Being from Nalgene I also expect it will be very durable and their lifetime warranty backs this up. Although it’s more expensive, it may last longer.
Aluminum Water Bottles
While aluminum water bottles check all the boxes for use-cases, there is a reason most reputable brands like Nalgene, Camelbak, and Hydro Flask don’t make them…
Aluminum bottles require a lining that is critical to prevent the metal from leaching into the water and to prevent any metallic taste. While it’s cheaper, lighter, and just as recyclable as stainless steel, the lining in aluminum bottles is often a BPA or BPS plastic which presents an avoidable health concern.
I recommend sticking with stainless steel if you’re going with a metal water bottle.
Collapsible water bottles are almost exclusively designed for hiking and backpacking. As a result of being lighter and collapsible they are also less durable. So they are not particularly well suited for everyday use.
However, if you have a unique situation that warrants a collapsible water bottle, start by checking out these top brands:
Glass water bottles are a great choice for home use and light commuting. Glass has a smaller environmental footprint than other bottle materials and are safer than most bottles made with plastic or plastic lining (aluminum). The only drawback is their weight and fragility, but many new models come with a protective sleeve to reduce the chance of breaking.
Takeya is a reputable brand, known more for their insulated stainless steel bottles. There aren’t too many options when it comes to glass water bottles with straws, but this is one of the top brands.
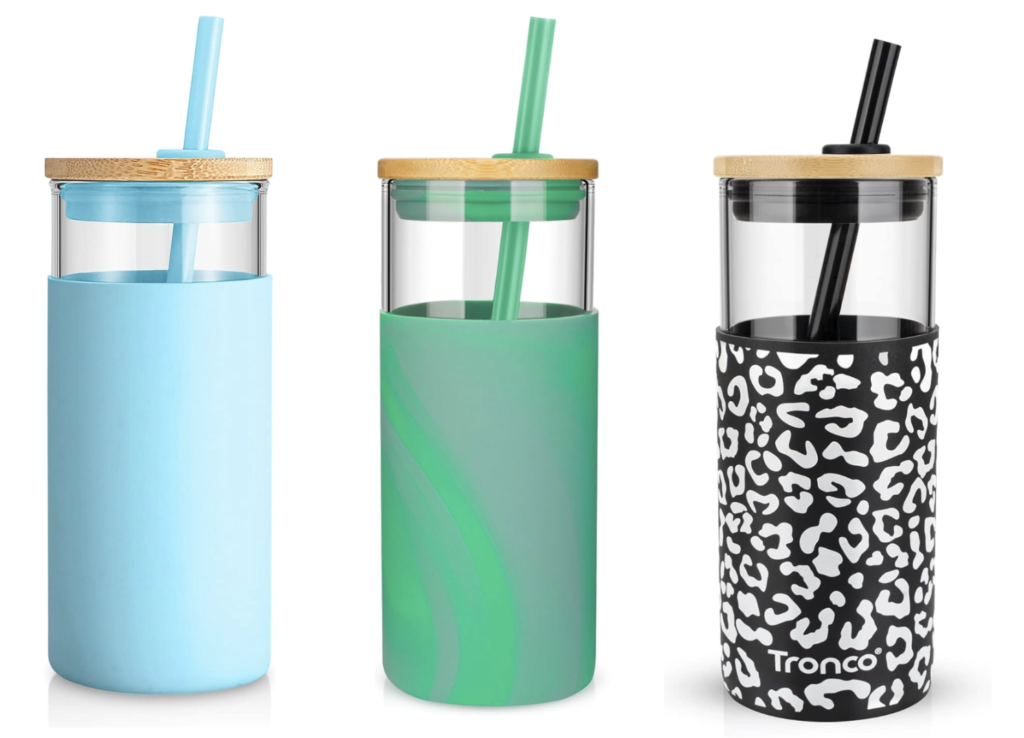
tronco bottles have a nice design that make for a great bottle for water, coffee, or tea around the house or office. The design is best suited for tables, desks, or cup holders, so it won’t be as versatile as options with tops that seal completely.
Final Recommendations
The important part about getting a bottle is using it in lieu of single-use bottles. While each type of reusable bottle is made for slightly different uses and of different materials, the main purpose remains the same. I recommend keeping these two tips in mind for your final selection:
Functionality – choose a bottle that fits most of your needs. If possible find one bottle that covers most of your hyrdration needs.
Likeability – get a bottle you like. Take some time to find one that you feel matches you and you’ll be happy to carry around. The more you like it the more you’ll use it.
Thank you for your interest and effort in reducing single-use plastics!