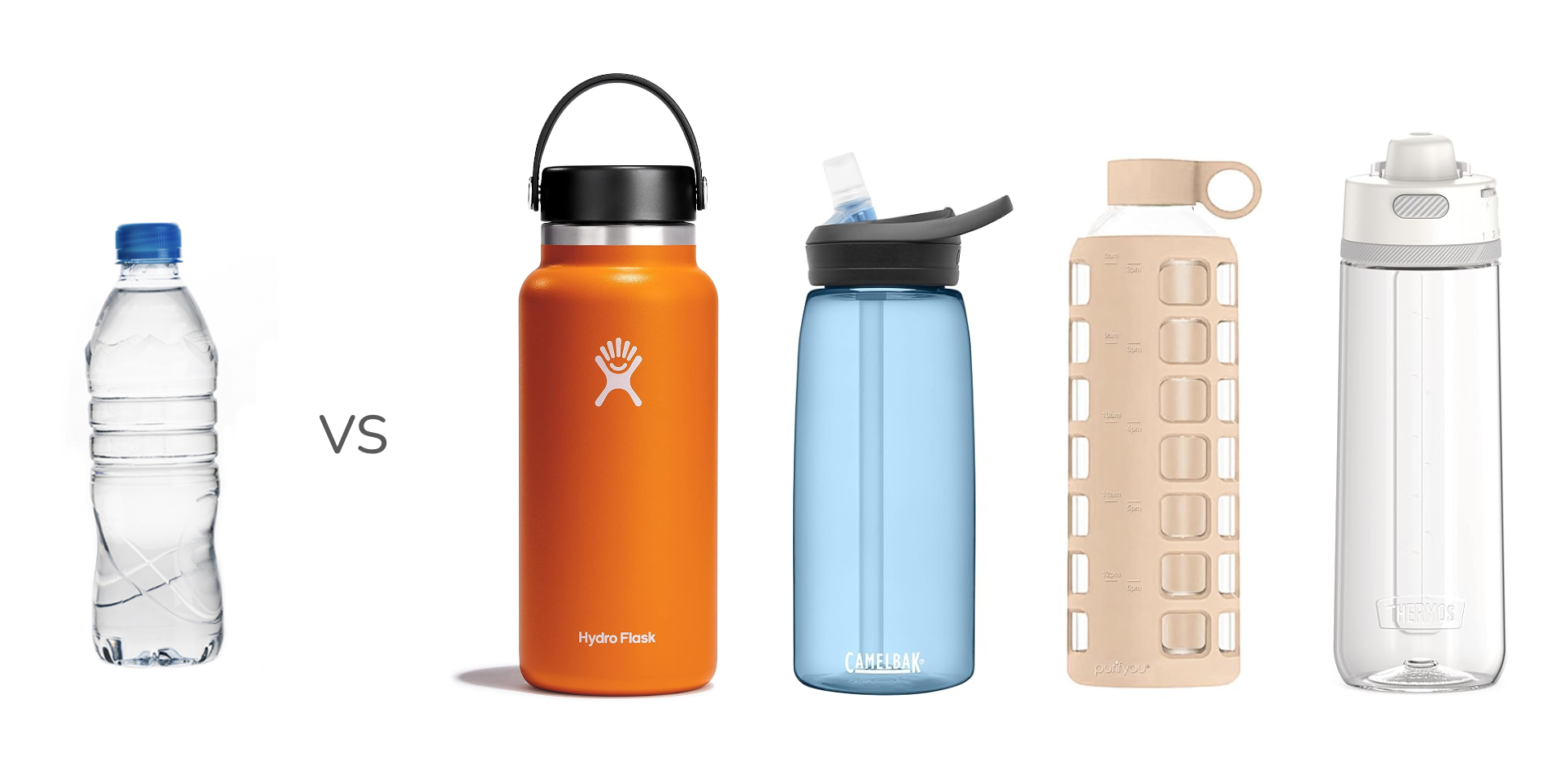
Will a reusable water bottle lower your environmental footprint?
In this post I will answer three main questions:
- How can we compare the environmental impact of one bottle vs another?
- How many times do I need to use a reusable bottle before it becomes more environmentally friendly than a single-use water bottle (the breakeven point)?
- What are the breakeven points for popular reusable water bottles like Nalgene and Hydro Flask?
The basics of comparing single-use vs reusable water bottles
Before answering any questions it’s important to have context around this question of disposable vs reusable. Varying opinions on whether single-use bottles are worse or better for the environment than reusable alternatives stem from unfair comparisons.
A few reasons why people may be comparing apples to oranges:
- Types – different types of single-use bottles have varying impacts. There are many variations of water bottles from their composition to the source of water they hold. There is even more variation in reusable bottles, material being a key variable. This makes it difficult to make blanket statements like “all single-use water bottles are worse than reusable alternatives”.
- Focus – depending on which aspect of environmental impact you’re focusing on, the results can vary. Energy use, natural resource use, pollution, and emissions, are just a few of the different areas you can compare. To understand the full cost, you have to consider the complete environmental impact of single-use vs reusable, not just one aspect.
- Other – Other variables such as the technology used to manufacture the bottle or how far it traveled to get the point of sale also changes the environmental impact.
They key indicators of environmental impact
These are the main 3 areas used to evaluate the life cycle of water bottles and some considerations to keep in mind for each:
- Production – What is the impact of manufacturing one bottle
- Natural resource extraction
- Energy use in attaining resources and manufacturing
- Transportation of resources and components or final products
- Use – How use of the product impacts humans or the environment
- Environmental impact of use
- Lifespan of the product
- Post Use – How disposal of the product impacts the environment
- Pollution of natural environment
- Emissions from disposal (gasses from breakdown in landfill or incineration)
- Cost of recycling
The total impact of a product can be calculated using our simplified formula:
Total Environmental Impact = Cost of Production + Cost of Use + Cost of Disposal
The process of calculating the total impact of a product is called a Life Cycle Analysis (LCA). In our research we look for LCAs and peer-reviewed papers that have calculated the impact of single-use bottles vs reusable alternatives.
The hot button environmental issues for water bottles
The most common types of environmental impact from water bottles include:
Emissions – global warming, air pollution
Natural Resource Use – deforestation, biodiversity loss, global warming
Pollution – biodiversity loss, degradation of natural environment
Some people may weight one factor as more important than another depending on their opinions of which environmental issue is most pressing.
The most common comparison for environmental impact is the product’s overall ‘carbon footprint’ which measures how much it contributes to global warming. The common metric used is Global Warming Potential (GWP) which is measured in kilograms of carbon dioxide equivalent (kg CO2 eq). This common metric allows us to compare various product types under the same metric and its what we’ve used to calculate breakeven points. A product with higher GWP, or more kg CO2 eq, is worse for the environment.
Breakeven Uses: When does a reusable water bottle become more environmentally friendly than a single-use bottle?
Depending on the composition of a reusable bottle, it can take between 2 and 90 uses before it becomes more eco friendly than a single-use water bottle. The table below shows this breakeven point for reusable water bottles by material. Below the table we’ve explained each range and the data behind them.
Breakeven Range: The number of times a bottle needs to be used in lieu of a single-use bottle before it has a lower Global Warming Potential than a single-use bottle. Comparison is to a conventional .5L (16.9oz) single-use bottle.
| Reusable Bottle Material | Breakeven Range (Number of Uses) |
|---|---|
| Glass | 2-6 |
| Plastic (PET) | 10-30 |
| Aluminum | 10-30 |
| Stainless Steel (Non-Insulated) | 10-30 |
| Stainless Steel (Insulated) | 30-90 |
Breakeven Estimates for Popular Bottle Types
Here are our best estimates for the breakeven points for the most popular types of reusable bottles organized by material type:
Plastics: Nalgene, Cambelbak, Etc.
Reusable water bottles made of PET plastic or similar variants such as Nalgene and Camelbak will be more sustainable than a single-use plastic water bottle after 10-30 uses.
Our Research: The input materials for all 3 variations of plastic listed here are very similar. The breakeven points for all of these materials are very similar.
Copolyesters – This is a variation of PET. The most relevant use in this context is Tritan plastic which is used in most modern Nalgene and Camelbak water bottles.
Polycarbonate – Plastic that is used in older generation Nalgene bottles, and still in some other brands.
PET – This is what most single-use bottles are made from and some reusable bottles are made with more, thicker, PET.
Data Sources: [1][2]
Glass: purifyou, Takeya, Etc.
Most reusable glass water bottles will be more sustainable than single-use plastic bottles after only 2-6 uses. Most brands have a silicone sleeve and plastic top which will increase the breakeven point.
- Glass Content – More glass will impact the GWP of a bottle but can also contribute to a longer lifespan, allowing for more uses.
- Caps – Account for a small portion of the bottle’s footprint; 10% or less. [1]
- Sleeves – We haven’t been able to find reputable literature regarding silicone sleeve’s contribution to a glass bottle’s GWP. To be cautious we have extended the breakeven range from 2-3 to 2-6 and will update our findings when reliable research is published.
Our Research: Multiple LCA research papers using various methods estimate glass bottles to be at a breakeven point of 2-3 uses. [4]
Stainless Steel:
Non-Insulated stainless steel bottles such as Bambaw and Nalgene will be more sustainable than single-use water bottles after about 10-30 uses. This is a wide variation because there are several unknowns about this new type of bottle.
Insulated stainless steel bottles such as Hydro Flask and Camelbak have a higher production cost which drives up their breakeven point to around 30-90. Insulated bottles have a design consisting of two layers of steel and a vacuum air insulation between the two levels. For manufacturing this means:
- More Materials – insulated steel bottles have about 3 times as much stainless steel as non-insulated bottles.
- More Energy – the manufacturing process is more involved, requiring more energy input.
Our Research: The breakeven point for stainless steel bottles was evaluated in the context of virgin stainless steel vs the Nestle Ecoshape Bottle. The Ecoshape bottle uses less plastic than a conventional single-use plastic water bottle. Given this, we can assume the breakeven point stated in this analysis (~10 uses) is higher than it would be in comparison to average water bottles so its safe to assume this is at the lower end of the range.[1]
Aluminum
(No common brands to note as this is not a recommended alternative. More info on aluminum bottles here.)
Our Research: The breakeven point for Aluminum was evaluated in the context of virgin aluminum vs the Nestle Ecoshape Bottle. The Ecoshape bottle uses less plastic than a conventional single-use plastic water bottle. Given this, we can assume the breakeven point stated in this analysis (~12 uses) is higher than it would be in comparison to average water bottles so its safe to assume 12 uses is at the lower end of the range.[1]
Other Variables To Consider
The production phase of a water bottle accounts for the biggest portion of its footprint and is comprised of resource input and manufacturing. Understanding the Global Warming Potential in this stage will provide a reasonable estimate for comparing bottle types and determining ranges for breakeven points.
The additional aspects listed here can shift the sustainability of a bottle, but are not nearly as big of a factor as the production phase.
Recycled Material
Some materials are more recyclable than others. This table shows the difference in recyclability between materials commonly used for reusable water bottles. Some key takeaways include:
- Aluminum is the most energy efficient to recycle. It has a high energy savings and low recycling complexity.
- Glass, Aluminum, and Stainless Steel can all be recycled again and again without degradation, while most plastics can only be recycled a limited number of times.
| Material | Recyclable | Recycling Efficiency | Energy Savings from Recycling | Recycling Process Complexity | Degradation on Recycling |
|---|---|---|---|---|---|
| Glass | Yes | High | 30-50% | Moderate | No |
| Aluminum | Yes | Very High | 95% | Low | No |
| Plastic (PET) | Yes | Moderate | 70-80% | High | Yes |
| Stainless Steel | Yes | High | 60-70% | Moderate | No |
In Production – Recycled Content
The energy required to manufacture water bottles is much higher when the materials are extracted from natural resources rather than from recycled sources. For all bottle types, the more recycled material incorporated into production, the lower its environmental impact. The more recycled material that is used for a reusable water bottle, the lower its breakeven point against single-use bottles will be.
In Post Life – Recycling of Used Bottles
If a bottle can be collected and recycled, its footprint drops significantly. The challenges we’ve found in our research regarding recycling:
- Only a small portion of bottles that are recyclable actually get recycled. A Greenpeace report from 2022 found that only 5% of plastics in the US are being recycled.
- There is an energy cost to collect and recycle items. This can vary widely depending on distances traveled and energy sources for collection and recycling.
- Infrastructure for recycling remains relatively low. Companies like Nalgene, CamelBak, and Hydro Flask have collection and recycling programs for their products.
Sourcing
While the production phase of a bottle accounts for the majority of its footprint, distance to market and the source of the water it holds are considerable factors. This is mainly a factor for single-use bottles. Reusable bottles are generally filled with tap or filtered water near the source of consumption.
Distance To Market
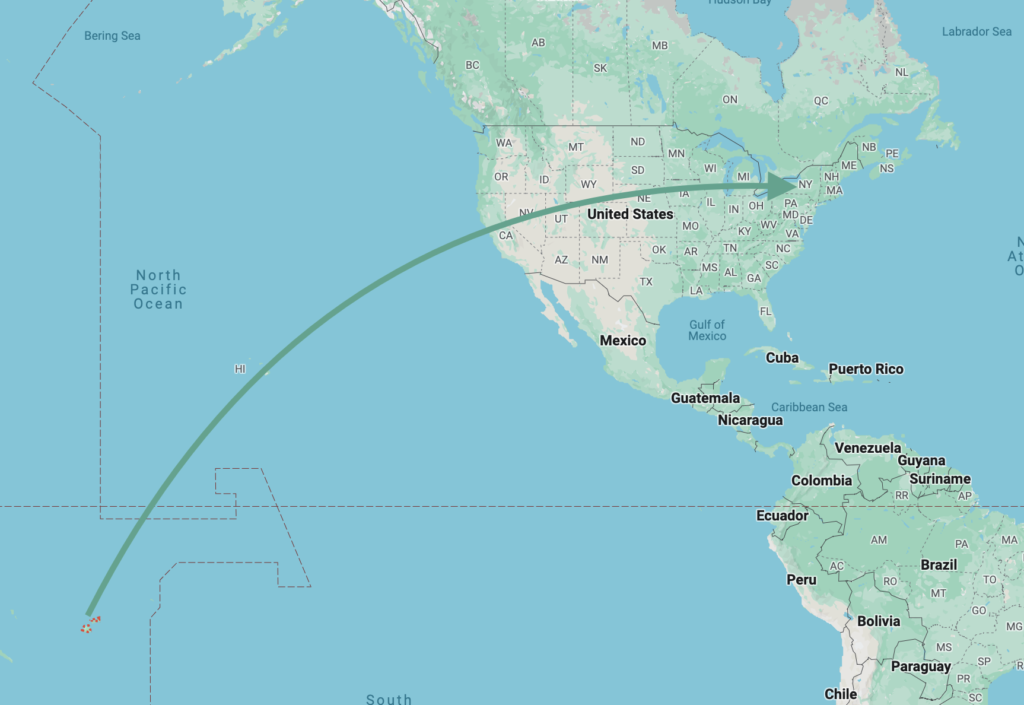
If you’re in New York city, water bottled upstate will have a much lower footprint than Fiji Water… which is bottled in Fiji.
The same applies for reusable water bottles. The further away your water bottle is manufactured, the bigger its footprint. This doesn’t have an outsized effect on the overall footprint for a few reasons:
- Transportation to destination market is one of many factors (production being the biggest).
- Bottles are generally being shipped in mass, which makes the overall emissions per individual bottle relatively low.
- Reusable bottles are shipped empty from origin of manufacturer. Single use bottles are often shipped twice:
- Once from manufacturer to the location where they will be filled.
- From filling location to destination market.
These factors are addressed in almost every life cycle analysis study we reviewed. Here’s a common example showing how much transportation contributes to the overall GWP of reusable bottles.
The best rule of thumb, as you already know, is that local is better. The further a product has to travel to get to us, the larger its footprint will be.
Frequently Asked Questions
Which single-use water bottles have the most plastic?
Bottles with an “eco shape” which have thinner plastic walls are on the low side. Brands with thicker bottles are on the high side. In a study that evaluated 55 brands, Voss and Fiji bottles had the most plastic.
How is the life cycle of a single-use water bottle calculated?
A life cycle analysis (LCA) evaluates each aspect of the water bottle’s life. LCAs are usually grouped into three phases:
- Production
- Use
- Post Use (Disposal)
Each phase is broken down into the smallest individual part and the best possible estimate for each part is researched. The sum of these parts is collected to evaluate the full life cycle. See a full explanation in our video here.
How does the number of times I use a water bottle change its environmental impact?
The more times you use a water bottle, the lower its Global Warming Potential (GWP) will be. This is because the reusable bottle’s impact in the production phase is distributed across the life of the product.
References: Key Data Sources
[1] Environmental Life Cycle Assessment of Drinking Water Alternatives and Consumer Beverage Consumption in North America (Access)
- About The Report: This is the most comprehensive and relevant life cycle analysis study on topic we’ve been able to find. While it was commissioned by Nestle Waters North America, it was done so with a stated mission to understand how to reduce their environmental footprint, is clear about the intentions of the project, and was reviewed by a panel of experts outside Quantis (the team commissioned for the study). The comparisons between the Global Warming Potential of single-use plastic bottles vs reusable alternatives is within the same range of other LCA studies we read.
- The final report was published on Feb 1, 2010.
[2] Life cycle assessment of single-use and reusable plastic bottles in the city of Johannesburg (Access)
Olatayo KI, Mativenga PT, Marnewick AL. Life cycle assessment of single-use and reusable plastic bottles in the city of Johannesburg. S Afr J Sci. 2021;117(11/12), Art. #8908. https://doi.org/10.17159/ sajs.2021/8908
- About The Report: This report is specific to the comparison of single-use and reusable PET bottles and is specific to Johannesburg, South Africa. It draws much of its data (like most studies we read) from other peer-reviewed studies and LCA databases. We evaluated the GWP of the production process of both bottle types to compare the impact and calculate the breakeven points. Our calculations and notes are available here.
- Published in the African Journal of Science in 2021
[3] Reusable vs Single-Use Packaging: A Review of Environmental Impacts (Access)
- About The Report: This report draws from various peer-reviewed studies to evaluate the sustainability of reusable vs single-use packaging. A key component they evaluated is water bottles. Where relevant and possible we went to the source research they referenced. We couldn’t access all studies referenced because some are behind pay walls. Those we were able to check were accurately referenced. The report was created by Reloop which states that it “works with governments, industry and society to accelerate the global transition to a circular economy for all resources”.
- Published in 2020
[4] Sustainability of reusable packaging–Current situation and trends
P. M. Coelho, B. Corona, R. ten Klooster, and E. Worrell, “Sustainability of reusable packaging–Current situation and trends,” Resour. Conserv. Recycl. X, vol. 6, no. March, p. 100037, 2020.
- About The Report: This meta analysis of various LCAs on glass bottles vs plastic bottles is referenced in several reports we read including the Reloop Report [3] and a report by NORSUS, The Norwegian Institute for Sustainability Research. The report concludes that across the board, research evaluated glass bottles to have a breakeven point of 2-3 uses vs plastic bottles.
- Published in 2020