Reduce, reuse, refuse: tips to cut down plastic use in your kitchen

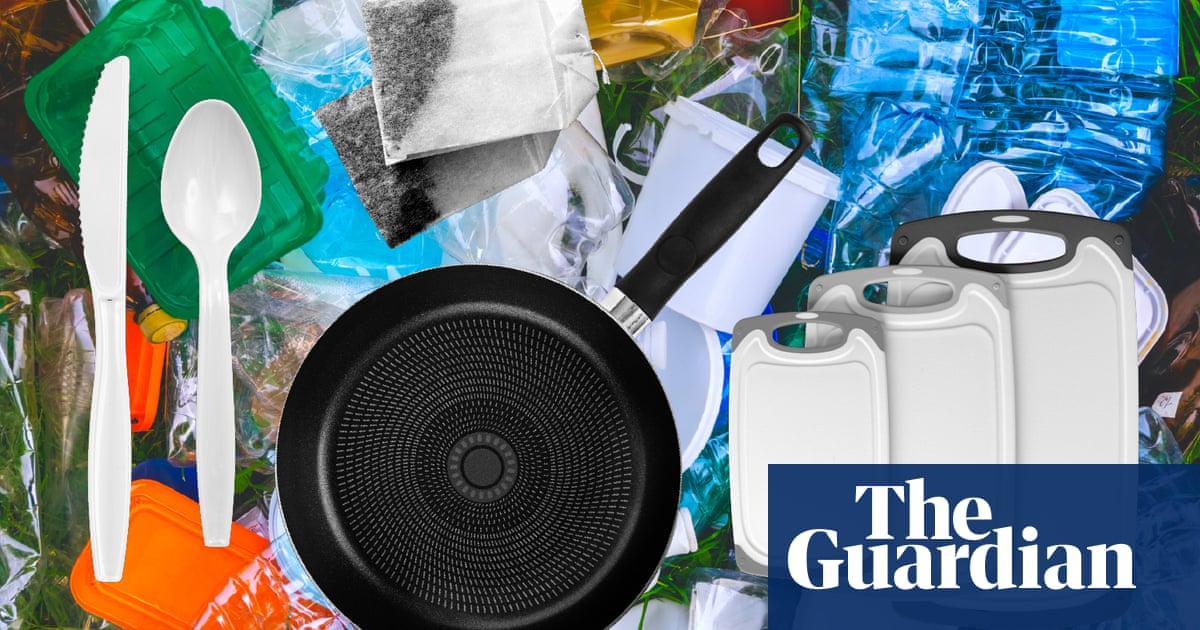
Cutting boards, non-stick pans, mixing bowls, even tea bags: in the kitchen, plastics can be hidden in plain sight.

It’s something that Jessica Brinkworth, an anthropology professor at the University of Illinois at Urbana-Champaign, realized once she began looking for ways to cut down on plastic use in her own kitchen after her workplace started doing the same. Although much of her lab’s waste was unavoidable – plastics are key for the sterile medical research they conduct – it still made her uncomfortable. That discomfort was only magnified in her own home, where she knew plastics were “largely a matter of convenience”.

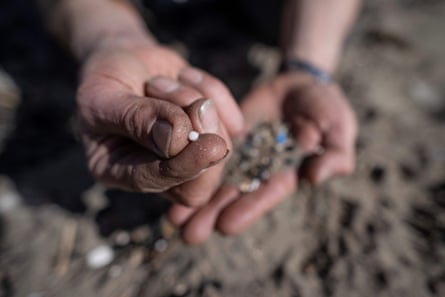
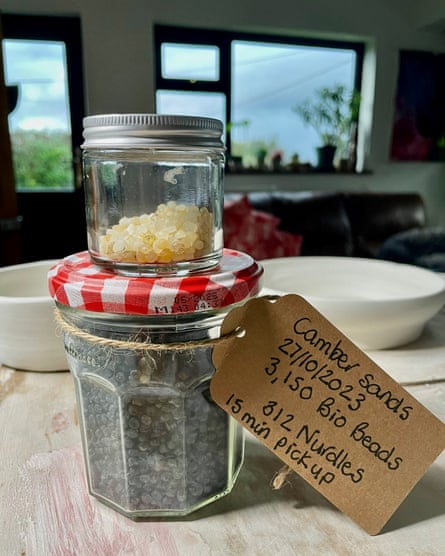
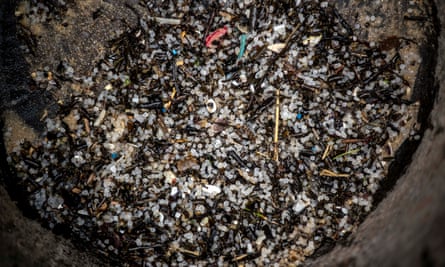
“Large macroplastics are a problem worldwide because we dump them on the shores of other nations,” she says, where things like plastic bottles block access to food for coastal nations and kill about a million people a year due to flooding, landslides and other environmental disasters. Much smaller plastics, like micro and nanoplastics, which are tinier than a grain of rice, “pose a whole other level of problem. Many types of plastic are endocrine disruptors,” meaning they disrupt the excretion and use of insulin, which can lead to obesity and reproductive health disorders.

Every year, we dump 10m tons of plastic into the ocean, killing a million marine animals annually. That plastic can work its way into our bodies from both the food we eat (most of our seafood contains microplastics) to how we cook in the kitchen.

“Plastic pollution is one of the most visible signs of the environmental crisis we’re facing with microplastics discovered on the highest mountains as well as in the depths of the oceans,” said Paula Chin, a senior policy adviser on consumption at the World Wildlife Fund. “They’ve also been found in our bodies with estimates suggesting we’re consuming a credit card’s worth of plastic each week.”

Brinkworth says solving our plastics problem will require massive regulatory action and coordination by federal and world governments, but that there are important ways consumers can make a difference.

“There’s so much that we’re producing in our kitchens that’s environmentally and publicly hazardous. But the reason why it’s in our kitchens is because that’s been made available to us,” she says. “One of the great acts of the plastics and petroleum industry has been to convince us that it’s a personal responsibility.”

That said, Brinworth notes that the climate crisis is happening now – and many people won’t survive waiting for innovative plastics recycling solutions to save the day. She encourages people interested in combating plastic pollution to reduce, reuse and recycle – but most importantly to refuse, when they are able. “Consumers can take responsibility probably in the most effective way by trying to affect government change.”

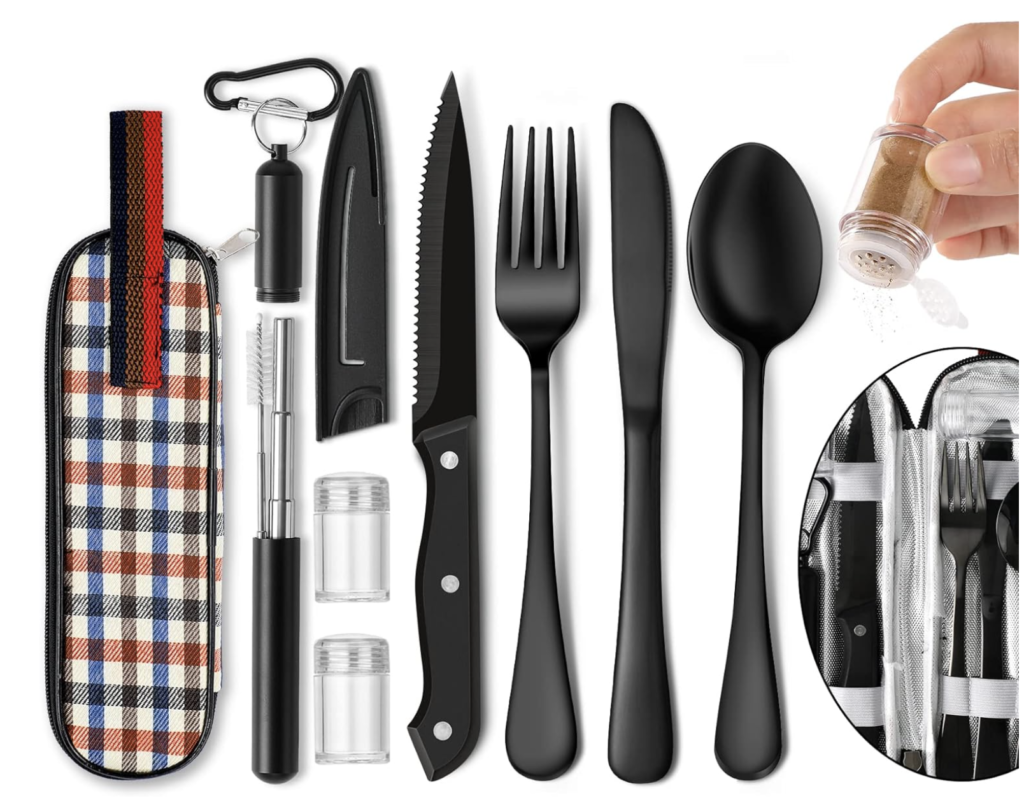
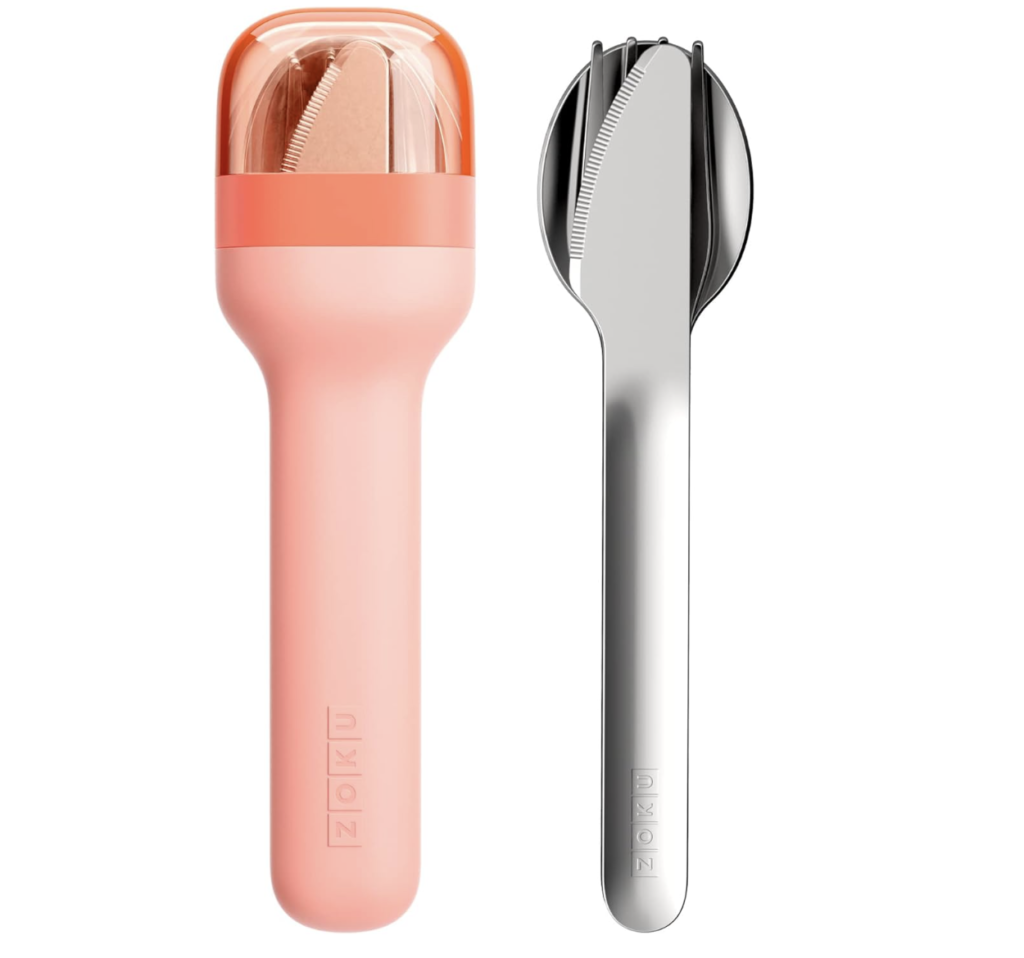
Here are Brinkworth’s and other experts’ tips on ways to reduce and refuse plastic waste in your kitchen.

Shopping

Plastics are omnipresent at the grocery store – think of the cellophane used to cover pre-chopped mushrooms, milk cartons, and packages of pre-sliced meats. It’s difficult to entirely avoid them, but, Chin says, “there are ways to cut-back.”

The first and most important way to do that, she says, is to simply buy less. “Make a conscious choice to avoid buying products you don’t need and when you do, look for products that are made from sustainably sourced natural materials.” The more you cook from scratch, the less plastic you’ll use from packaged or processed foods (think about all of the plastic used to wrap frozen vegetables, cover chopped produce and package frozen dinners).

When shopping, not just for groceries but also for kitchen appliances, Chin recommends first questioning whether you need something, then trying to reuse what you already have, before finally looking “for options which include recycled content.” That won’t save you the health risks of plastic use, but it can have a significant environmental impact. According to a 2021 report from the World Economic Forum, reusing just 10% of plastic products, could prevent almost half of annual plastic ocean waste.

If you haven’t already gotten in the habit of taking your own bags to the grocery store, start – and while you’re at it, consider adding your own reusable produce bags. But shopping at traditional grocery stores isn’t your only option: more zero-waste shops are springing up across the country (where you can bring your own containers or use non-plastic ones the store offers to take home exactly as many lentils or bunches of broccoli as you’ll use) and plenty of farmer’s markets allow customers to bring their own glass jars or produce bags so you’re not toting home plastic cartons. Depending on where you live, you might even be able to swap plastic milk cartons for glass bottles (and rekindle the nostalgia of a visit from the milkman) by opting into a milk delivery service.

Cooking

You might not think there’s very much plastic in your kitchen if you’re only thinking about clear packaging, but almost every household is home to at least some plastic kitchen appliances. Think about your cutting board, mixing bowls, non-stick (Teflon-coated) pans, spatulas, blender or food processor.

Plastic appliances can release high levels of micro and nanoplastics, says Brinkworth, especially if we’re heating with, chopping on or blending in them.

Earlier this year, researchers at North Dakota State University published a study that found that chopping on plastic cutting boards can release millions of microplastics each year. Other recent research has counted the microplastics released from using plastic mixing bowls, blenders, kettles and non-stick pans.

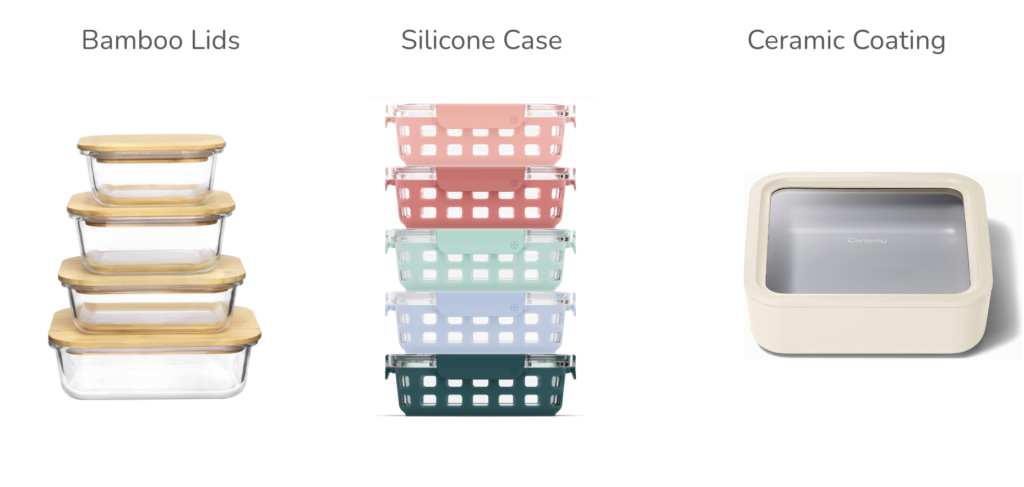
The best way to avoid that? Switch your plastic appliances out for metal, glass or wooden ones where possible, says Brinkworth. But be careful when looking at wood or bamboo appliances that you consider the glue used to hold them together. Even just the glue used to seal a tea bag can release billions of microplastics.
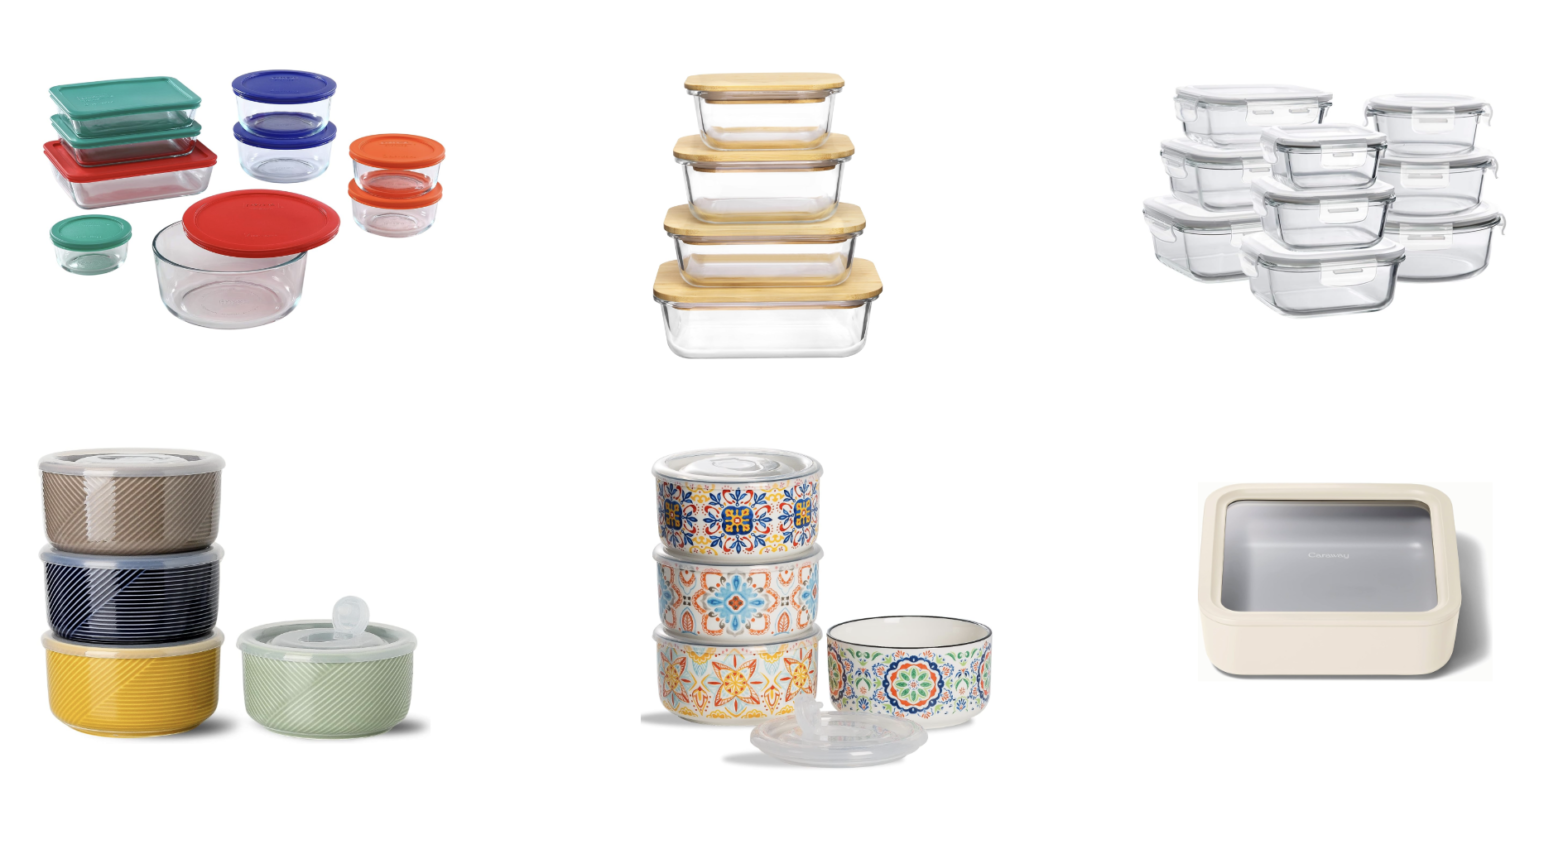
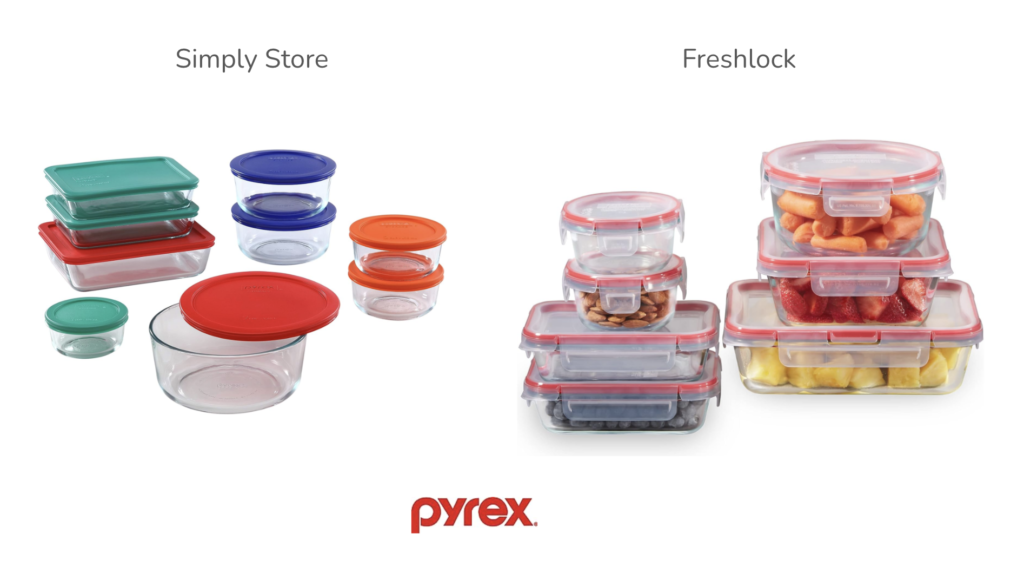
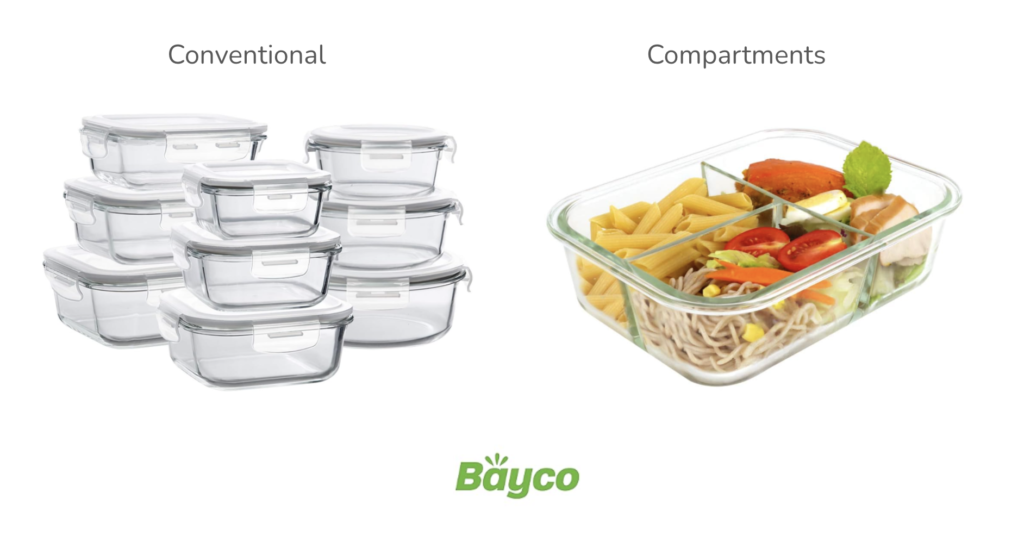
Storing

Plastic wrap has easily one of the greatest impacts on the environment: we only ever use it once and it can take close to 1,000 years to decompose in landfills. And plastic packaging – think cling wrap, sandwich bags and candy wrappers – makes up almost half of the plastic waste that ends up in the ocean. It’s so convenient that it can be difficult to imagine any good alternatives, but Brinkworth encourages consumers to try reusable alternatives.

The price point for reusable cling wrap can be high, which is why Brinkworth and her family made their own. It’s pretty simple: cut cotton fabric to the sizes you’d like your cling wrap to be, lay them out on a baking sheet in the oven and cover them with beeswax (Brinkworth recommends adding jojoba oil to make the wraps more flexible), and bake for two to three minutes. If all that sounds like too much work though, you can pick up reusable beeswax cling wrap at many grocery stores.

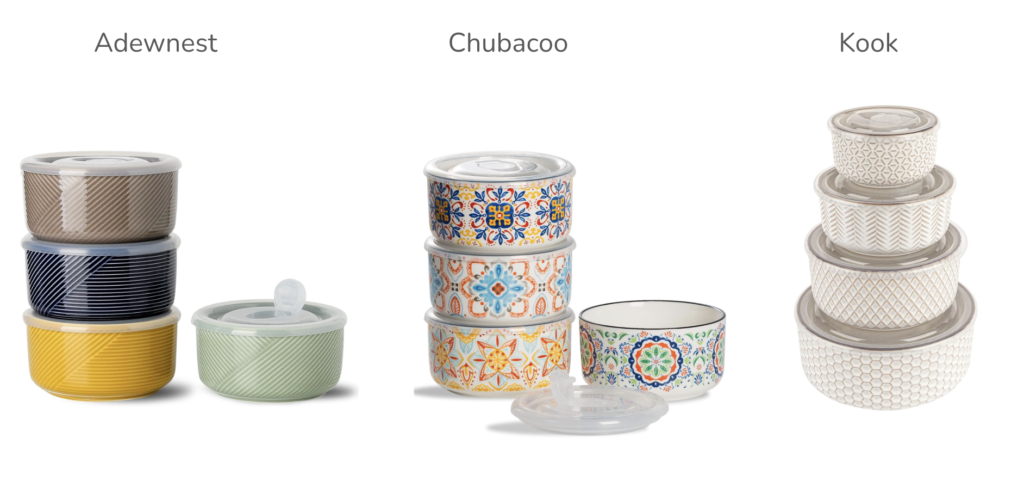
Brinkworth says the reusable cling wrap is easy to clean, but will eventually start to flake. “Honestly, a simpler solution for most people would be just to use mason jars,” which you can find for about a dollar a piece at many thrift stores. In general, switching to glass jars (or glass storage containers, if they’re in your budget) is better for the environment and your body. Plastic containers can leech cancer-causing and hormone-disrupting chemicals into your food.

Cleaning

If you thought you had cleared your kitchen of plastics, the prevalence of plastic in your cleaning routine might surprise you. Dishwasher pods get the worst rap (the polyvinyl alcohol wrapping doesn’t break down in water treatment plants), but if the interior of your dishwasher is made out of plastic, it’s releasing microplastics with every wash. Few dishwashers have no plastic whatsoever, says Brinkworth, but she recommends splurging for a stainless steel interior if you can afford it (or hand washing when your life allows).

Handwashing won’t get rid of all the plastics in your kitchen though either – if you’re using liquid dish soap, it’s likely packaged in a plastic bottle. Fortunately, a few brands have started selling dish soap bars and liquid dish soap packaged in cardboard. Most sponges are made of plastic too, but more stores are selling natural sponges and dishcloths as demand increases. Those can be worthwhile alternatives to keep plastic out of your own body and from slipping down the drain.

Tesco switches pocket tissue packaging to paper to cut plastic waste

Tesco is scrapping plastic packaging from its own-brand pocket tissues, in a move that the UK’s largest supermarket says will eliminate almost 35 tonnes of new soft plastic waste each year.

It is the first big supermarket to make the change, which will result in the individual packaging and the wrapping around multipacks of Tesco tissues in its gentle white and balm ranges being replaced with Forest Stewardship Council-certified paper packs.

Tesco started the rollout before Christmas, and said the changes would keep more than 55m pieces of soft plastic from entering landfills and the wider environment every year.

“Unlike boxes of tissues, the pocket version tends to be used on the go and can all too easily become litter,” Tesco’s campaign manager Courtney Pallett said. “The new paper packaging works just as well as the old plastic wrap but is more sustainable.”

Tesco is one of the major signatories of the UK Plastics Pact, which is led by the sustainability charity Wrap and has set targets to hit by 2025, including eliminating problem plastic and ensuring that 100% of plastic packaging can be reusable, recyclable or compostable.

In its latest annual report, the pact’s directors detailed their progress to date, which includes the removal of 730m plastic items from supermarket shelves since 2018, and the fact that rigid plastic packaging is now 94% recyclable.

Tesco says the company has removed almost 2.2bn pieces of plastic from its operations since 2019. That includes wrapping around multipack tins and greetings cards, lids from products including wipes, yoghurts and creams, and plastic bags from its grocery deliveries.

However, part of that pressure has come from government-mandated changes, including rules that came into force in 2020 to restrict the supply of single-use plastic straws, drink stirrers and cotton buds, and a tax introduced in 2022 on plastic packaging that was not at least 30% recycled.

skip past newsletter promotion

Meanwhile, the consumption of single-use supermarket plastic bags has fallen by 98% since retailers in England began charging for them in 2015.

Home Soda Machine (Soda Stream) vs Bottled Soft Drinks

Is a home soda machine like Soda Stream more sustainable than buying bottled soft drinks?

Short Answer: A home soda machine can be more sustainable than buying bottled soft drinks, but it may take longer than you expect. You’ll have to make between 44 and 174 servings of your own soda before the soda machine becomes more eco friendly than single-use bottles. Where you fall on this range depends on the type of bottle your displacing (glass, plastic, or aluminum).

Depending on how much soda you drink, the time for it to be more sustainable (and more economic) can be as short as a month or as long as a few years. See the full breakdown by scenario below.

Full Answer: To truly understand the sustainability and economics of a soda machine vs bottled soda we had to dig much deeper…

In this post we break down the environmental impact of a Soda Stream vs soft drinks that come in glass, plastic, and aluminum bottles. We’ll answer these key questions:

  1. Methodology – How do you evaluate the sustainability of a Soda Stream vs various types of bottled beverages?
  2. Breakeven Uses – How much soda do you need to make at home before the impact of the Soda Stream machine becomes more sustainable than buying bottles? And how does this differ between materials like plastic vs aluminum and size?
  3. Economics – How much money can a home soda machine save you?

If you have additional questions after reading this post, please let us know.

Methodology: The GWP of Single-Use vs Soda Stream

To compare the environmental impact of a bottle of soda bought in the store vs a bottle of soda made at home with Soda Stream (or similar machine), we need to find a common metric of comparison. The process to determine the impact of a product from its creation through to its disposal is called a Life Cycle Analysis. The key metric that results from a life cycle analysis is Global Warming Potential (GWP) measured in kilograms of CO2 equivalent (kg CO2 eq).

We’ve found the GWP for the main Soda Stream model and common soft drinks that come in aluminum cans, plastic bottles, and glass bottles. With this information we’re able to calculate and compare the GWP of soda made with the Soda Stream vs a bottled alternative.

Note: Plastic pollution is a separate component, which we have also evaluated and compared so you can see how much plastic is saved by using a home soda machine vs buying plastic bottles.

Here’s what we found:

Environmental Impact: Soda Stream vs Bottled Soda

Each type of bottle used for delivering soda has a different environmental impact. In the context of Global Warming Potential, soda delivered in glass has the highest impact. When it comes to plastic footprint, 0.5L bottles are the worst offender. In most cases, a home soda machine has a lower GWP, but it can take a while to reach this breakeven point.

Here’s how the Soda Stream stacks up against each bottle type:

Breakeven Points by Bottle Type

How much soda do you need to make at home before a Soda Stream has a lower GWP than single-use bottles?

The amount of soda we would need to make at home ranges from 33 liters to 146 liters depending on the type and size of bottles we are comparing it to.

Breakeven Points by Volume

How many liters of soda would you need to displace before a Soda Stream becomes more environmentally friendly?

This chart shows how many liters of soda we would need to make at home in order to make a Soda Stream more sustainable. Since 2L plastic bottles are the most sustainable delivery of soda by volume, it will take more home soda production to become more sustainable. .75L glass bottles, on the other hand, are the least sustainable way to deliver a serving of soda. If you’re buying soda in glass bottles, you can offset your footprint much faster than if you’re buying 2L plastic bottles.

Breakeven Points by Number of Bottles

How many bottles of soda would you need to displace before a Soda Stream becomes more environmentally friendly?

Here is the breakdown by bottle type:

  • Aluminum: 174 – you would have to make 174 12oz servings with a soda machine before it becomes more environmentally friendly than buying cans.
  • Plastic Bottles (PET)
    • 16.9oz (.5L): 134 – it would take about 134 .5L servings to reach breakeven
    • 67.6oz (2L): 73 – it would take about 73 2L servings to reach breakeven
  • Glass: 44 – you would have to make 44 25oz servings with a soda machine before it become more sustainable than buying glass and more than twice this much if comparing to 12oz glass bottles.

Economics: Soda Stream vs Bottled Soda

How long will it take for my home soda machine to become more sustainable than buying single-use bottles?

AND

When does a Soda Stream become more cost effective than buying bottled soft drinks?

To answer these questions, let’s look at a few scenarios.

Scenario 1: Aluminum Cans vs Soda Stream

The Environmental Question: How long will it take for a soda stream to have a smaller environmental footprint than aluminum cans?

You would need to produce 63 liters of soda, the equivalent of 173 12oz cans, for a Soda Stream to have a lower GWP than buying cans.

Key Takeaways from This Video:

  1. Environmental Break-Even for Soda Stream vs. Aluminum Cans: To become more environmentally friendly than aluminum cans, a Soda Stream must produce 63 liters of soda.
  2. Number of Cans To Break-Even: The 63 liters equate to 174 cans of soda. To be more environmentally friendly with a Soda Stream, one would need to replace the consumption of 174 cans.
  3. Time to Reach Environmental Break-Even:
    • Approximately three years for drinking one can per week on average.
    • About one year for drinking one can every other day.
    • Roughly six months for drinking one can per day.
    • About one month for consuming six cans a day.
  4. Cost Comparison:
    • Buying 15 12-packs of cans (180 cans) costs about $112.
    • Using a Soda Stream requires a starter pack and flavor refills, totaling approximately $206, but yields more than the equivalent of 174 cans (about 72 liters).
  5. Overall Expense for Environmental Break-Even: Reaching the environmental breakeven point with a Soda Stream costs around $200.

    The Economic Question: How long will it take for a soda machine to be more economical than buying cans?

    The Soda Stream becomes cheaper than continuously buying cans after around 400 to 500 servings, which is about $300 worth of soda.

    Key Takeaways from This Video:

    1. Initial Cost of Soda Stream: The first 12-ounce drink from a Soda Stream is initially very expensive due to the initial purchase of the machine. However, this cost significantly decreases as more drinks are made.
    2. Ongoing Costs for Refills: Users need to buy flavor refills every 36 liters, leading to occasional spikes in the cost per serving. Additionally, CO2 refills are required, albeit less frequently.
    3. Cost Comparison Over Time: The initial cost for the Soda Stream is higher compared to buying a 12-pack of cans. However, the long-term cost increase of using the Soda Stream is slower than the continual purchase of 12-packs.
    4. Breakeven Point: Economically, the Soda Stream becomes cheaper than continuously buying cans after around 400 to 500 servings, which is about $300 worth of soda.
    5. Cost to Reach 500 Servings: To achieve 500 servings, one would either need to buy 42 12-packs of cans (costing about $311) or use a Soda Stream with a starter pack, five flavor refills, and one CO2 refill.
    6. Time to Economic Break-Even: The duration to reach this economic breakeven point varies based on consumption habits:
      • Nearly 10 years for drinking one can per week on average.
      • Two and a half to three years for drinking a couple of cans per week.
      • One and a half years for drinking one can per day.

    Scenario 2: 0.5L Plastic Bottles vs Soda Stream

    The Environmental Question: How long will it take for a soda stream to have a smaller environmental footprint than single-use bottles (.5L / 16.9oz)?

    Key Takeaways from This Video:

    • Breakeven for Environmental Friendliness: A home soda machine becomes more environmentally friendly than single-serve half-liter PET bottles after producing 67 liters of soda, equivalent to displacing 134 of these bottles.
    • Time to Reach Environmental Breakeven: The time to reach this breakeven point depends on consumption rate:
      • Over two and a half years if you drink one bottle per week.
      • Nine months when drinking a bottle every other day.
      • About four and a half months when drinking one bottle per day.
      • Approximately three weeks if you drink six bottles per day.
    • Plastic Footprint Reduction: The home soda machine significantly reduces the plastic footprint compared to single-serve bottles. This is because the soda machine uses fewer refill bottles per serving, as opposed to the rapidly accumulating number of single-serve bottles.
    • Cost Comparison for Environmental Break-Even:
      • For bottled soda: Buying 22 six-packs (around 138 bottles) to reach 67 liters costs about $115.
      • For the soda stream: The starter pack plus one refill pack, totaling close to $200, is needed to reach the same volume.
    • Economic Consideration: While it is more expensive initially to use a home soda machine, it becomes more economically viable over time, as well as more environmentally friendly.

    The Economic Question: How long will it take for a soda machine to be more economical than buying single-use bottles (.5L / 16.9oz)?

    The breakeven point, where the soda machine becomes more economical than buying bottles, is estimated to be around 400 to 500 servings, or approximately $350 in total expenditure.

    Key Takeaways from This Video:

    • Initial High Cost of Soda Machine: The first half-liter drink made with a soda machine effectively costs around $180 due to the initial purchase of the machine.
    • Decreasing Cost Per Serving: The cost per serving decreases significantly as more drinks are made at home, despite the need for occasional flavor refills (every 36 liters) and less frequent CO2 refills (ever 60 liters).
    • Break-Even Point: The breakeven point, where the soda machine becomes more economical than buying bottles, is estimated to be around 400 to 500 servings, or approximately $350 in total expenditure.
    • Economic Break-Even in Terms of Quantity: To reach an economic breakeven of about 216 liters, one would need to buy 72 six-packs (432 bottles). In contrast, the equivalent amount with a soda stream involves buying a starter pack and sufficient refills, totaling about $313.
    • Time to Economic Break-Even: The time to reach the economic breakeven point varies based on consumption: about 8 years for drinking one bottle per week, 4 years for one bottle every other day, and approximately 1 year and 2 months for one bottle per day.

    Scenario 3: 2L Plastic Bottles vs Soda Stream

    The Environmental Question: How long will it take for a soda stream to have a lower GWP than buying 2-liter soda bottles?

    A home soda machine like the Soda Stream becomes more environmentally friendly than two-liter bottles after producing 146 liters of soda, which is 73 2-liter bottles.

    Key Takeaways from this Video:

    • Global Warming Potential: In terms of global warming potential, the two-liter plastic bottle is initially more environmentally friendly than smaller plastic bottles, aluminum cans, or glass bottles. This is due to more soda being provided per amount of plastic used.
    • Break-Even Point for Soda Machine: A home soda machine like the Soda Stream becomes more environmentally friendly than two-liter bottles after producing 146 liters of soda.
    • Comparison of Usage: To be more environmentally friendly than a soda machine, one would need to avoid purchasing 73 two-liter bottles, instead producing the equivalent amount of soda at home.
    • Time to Environmental Break-Even: Depending on consumption, the time to reach this break-even point varies. It’s approximately 1.5 years for consuming one two-liter bottle per week, 9 months for consuming a couple of bottles per week, and less than 3 months for daily consumption.
    • Plastic Footprint: Over time, the number of two-liter bottles used grows faster than the refill bottles needed for a home soda machine. This difference highlights the potential for reducing your plastic footprint.
    • Cost Comparison: To reach the environmental break-even point of 146 liters, the cost is around $143 for purchasing 73 two-liter bottles. In comparison, to achieve the same amount with a Soda Stream, the initial investment is higher due to the cost of the starter kit, flavor refills, and CO2. To exceed 146 liters with a Soda Stream it will cost over $300.
    • Overall Economic and Environmental Considerations: While it’s more expensive to use a soda machine initially, it becomes more environmentally friendly over time. The economic aspect of using two-liter bottles versus a soda stream is also a factor to consider, with the two-liter bottle being more economical initially.

    The Economic Question: How long will it take for a soda machine to be more economical than buying 2-liter soda bottles?

    The soda machine becomes more economical after approximately 600 to 700 servings, equating to around $1,300 worth of soda.

    Key Takeaways in This Video:

    • Initial High Cost of Soda Machine: The cost of creating the first two liters of soda with a machine is high due to the need to buy the machine, flavoring, and CO2.
    • Recurring Costs for Flavor and CO2: Frequent purchases of flavor refills and CO2 are required, especially because of the high volume of soda produced compared to smaller packages like 12-ounce cans or half-liter bottles.
    • Comparison of Total Costs Over Time: Initially, the cost trajectory of using a soda machine is high due to frequent refills. However, over time, it becomes more cost-effective compared to the constant cost of two-liter bottles.
    • Break-Even Point: The soda machine becomes more economical after approximately 600 to 700 servings, equating to around $1,300 worth of soda.
    • Long-Term Savings: Beyond the break-even point, the cost per liter for the soda machine continues to decrease compared to the cost of buying two-liter bottles.
    • Quantity Comparison: To reach 1,332 liters, one would need to buy 666 two-liter bottles or use a soda machine with a starter pack, 38 four-packs of flavoring, and 18 CO2 refills.
    • Time to Reach Economic Breakeven Point: Depending on consumption habits, reaching the breakeven point can vary from 13 years (for one two-liter bottle per week) to about two years (for daily consumption of one bottle).

    FAQ

    How is the life cycle of each bottle type calculated?

    Each step throughout the life of a bottle is evaluated and its GWP is quantified. The sum of each step provides the overall Global Warming Potential for each bottle type. We accessed this information from a life cycle analysis research paper on glass, aluminum, and plastic bottles [1].

    Key Takeaways from LCA of Bottled Soda Beverages:

    1. The Production phase of each bottled beverage type (glass, aluminum, plastic) accounts for the biggest impact within its life cycle.
    2. Glass has the biggest impact on a per-liter basis, followed by aluminum and then plastic

    Resources

    [1] Life cycle environmental impacts of carbonated soft drinks; Amienyo et al. (2013), Accessed on Dec 23, 2023 on ResearchGate

    [2] SodaStream 2020 Sustainability Report, Accessed on Dec 23, 2023

    What is a life cycle analysis (LCA)?

    A life cycle analysis (LCA) for a product is a comprehensive method used to assess the environmental impacts associated with all stages of a product’s life. This includes raw material extraction, materials processing, manufacture, distribution, use, repair and maintenance, and disposal or recycling. Here’s a simple overview of the key aspects of a life cycle analysis:

    Purpose of LCA: It is primarily used to evaluate the environmental footprint of a product from “cradle to grave.” It helps in understanding the complete picture of the environmental impacts and identifying opportunities for improvement in the product’s life cycle.

    Conducting an LCA: The process usually involves several steps:

    • Goal and Scope Definition: Determining the purpose of the LCA and the boundaries of the study (e.g., which life cycle stages to include).
    • Inventory Analysis: Gathering data on the energy and material inputs and environmental releases associated with each stage of the product life cycle.
    • Impact Assessment: Assessing the potential environmental impacts of the data collected in the inventory analysis, often categorized into different impact areas like global warming, ozone depletion, water pollution, etc.
    • Interpretation: Analyzing the results to make informed decisions or recommendations.

    Data Sources: The data for LCA comes from a variety of sources, including:

    • Empirical data from specific processes or locations.
    • Industry data or databases that compile information on material production, energy use, emissions, etc.
    • Published literature and government reports.

    Standardization: LCA is standardized through international standards such as ISO 14040 and ISO 14044. These standards provide guidelines on principles, framework, methodology, and reporting of LCAs. They ensure consistency, transparency, and credibility in the LCA studies.

    How We Use LCAs

    We use LCAs to help us understand the environmental footprint of a product. This can help us answer questions like these:

    • What types of products have the biggest or smallest environmental impact?
    • How do different types of packaging for bottled beverages impact the footprint of those products?
    • How can we make informed decisions to use products that have a smaller footprint?

    Whenever possible we use LCAs that have been peer-reviewed and published in reputable scientific journals. This increases our confidence that the LCA data is accurate and the process used has been vetted by experts. It’s important to remember that even the best LCA is still an estimate of a product’s environmental footprint. It often gives us a good approximation, but not the exact impact, which is going to vary product by product as the inputs can vary.

    More About LCAs:

    Global Warming Potential (GWP)

    Global Warming Potential (GWP) is a crucial metric used within the context of a Life Cycle Analysis (LCA) to measure the potential impact a substance has on global warming.

    GWP is vital in a LCA because it provides a standardized method to evaluate and compare the climate change impacts of products, processes, or services.

    More Info:

    1. Definition of GWP: GWP is a relative measure that compares the amount of heat trapped by a certain mass of a greenhouse gas (GHG) to the amount of heat trapped by a similar mass of carbon dioxide (CO2). Essentially, it is a way of quantifying how much a given GHG contributes to global warming compared to CO2.
    2. Time Horizon: GWP values are typically calculated over specific time horizons, such as 20, 100, or 500 years. This is because different gases remain in the atmosphere for different lengths of time and have varying short- and long-term effects on temperature.
    3. Use in LCA: In an LCA, the GWP is used to assess the potential climate change impact of different emissions across a product’s lifecycle. It enables the comparison of the impacts of different GHGs in a common unit. For instance, if a product’s lifecycle releases methane and CO2, the GWP allows these emissions to be converted into a CO2 equivalent (CO2e) value based on their respective GWPs, facilitating a more straightforward comparison and aggregation of climate impacts.
    4. Importance: GWP is vital in LCA because it provides a standardized method to evaluate and compare the climate change impacts of products, processes, or services. This helps in identifying areas with significant GHG emissions and opportunities for reducing environmental impacts.
    5. Data and Standards: GWP values for various greenhouse gases are provided by scientific bodies like the Intergovernmental Panel on Climate Change (IPCC) and are used in accordance with international standards like ISO 14040 and ISO 14044 for LCAs.

    How We Use GWP

    We use GWP as a measurement of a product’s environmental footprint. This allows us to compare the impact of different products and how variations within a product – like using plastic vs glass in bottles – affect its environmental impact.

    Products with a higher GWP have a bigger environmental impact. Generally we are evaluating and comparing products to find the ones with the lowest GWP, so we can make more informed purchasing decisions and lower our own environmental footprint.

    How To: Reduce Plastic Waste from Soft Drinks

    3 Strategies You Can Employ Today

    I’ve used the first 2 strategies outlined here to significantly reduce my own environmental footprint and considerably improve my health. I’ve included the third strategy an another viable option.

    Take what works for you… and thank you for your effort to reduce plastic waste!

    Strategy 1: Switch Away from Plastic Bottles

    Continue enjoying the same drinks you like, but move away from plastic… in most cases. This is the first strategy not because it has the biggest impact (see Strategies 2 & 3 for that), but because it can be implemented quickly and easily.

    As detailed in our life cycle analysis of reusable vs single-use bottles, the most sustainable bottle types available for single-use are:

    1. Aluminum
    2. Plastic
    3. Glass

    In all cases, when the source of the materials are recycled it will be more sustainable than when the source is from virgin resources. So a glass bottle that comes from recycled materials will be more eco friendly than an aluminum bottle made with no recycled material. 

    Here’s how to help make a selection that fits your desired outcome:

    For The Environment

    In general, this type of selection process will help you reduce your environmental impact. It’s based on the Global Warming Potential (GWP) of each material.

    1. Go Recycled – The incorporation of recycled material drastically cuts the GWP of a bottle. At the point of purchase you’ll have to look for labels that specifically state the container was made from recycled material. The next best alternative is to look up which brands have recycled containers. 
    2. Select by Type – If you can’t find an option that has a high amount of recycled content, the best approach is to select in this order: aluminum, the lightest plastic possible, then glass. 

    If you weight other environmental factors higher than global warming, you can adjust your criteria accordingly. Here are a few examples: 

    Natural Resource Extraction / Habitat Damage

    You may want to select glass or plastic over aluminum, which has a higher impact when attaining the resources required. Here’s a table summarizing the impacts from the resources required for each material:

    AspectAluminumGlassPlastic
    Source of Raw MaterialsBauxite miningSand miningPetroleum or natural gas extraction
    Energy ConsumptionHigh; involves ore processing and smeltingModerate; melting processesVaries; generally high for production, especially for virgin plastics
    Greenhouse Gas EmissionsHigh; due to energy-intensive processesModerate; primarily from heating processesHigh; from fossil fuel extraction and processing
    Impact on BiodiversityCan be significant; deforestation, soil erosionLocalized habitat disruptionOil spills, habitat disruption

    Marine Debris

    In the case of marine debris, plastics are by far the worst offender. If this is your biggest area of concern, steer clear of plastics whenever you possibly can. 

    For Your Health

    If you want to steer clear of plastics for health reasons, choose glass whenever possible. Aluminum cans contain a clear lining made of plastic which has historically contained BPA and in many ‘BPA Free’ containers still has very similar alternatives such as BPS. 

    Recommended Selection:

    1. Glass
    2. Aluminum
    3. Plastic

    If you are health-conscious, then strategy 2 might be even more valuable to you.

    Strategy 2: Reduce Soft Drink Intake

    In most areas of our life, the best thing we can do to reduce our environmental impact is to consume less. In the case of soft drinks, this is also true for our health. 

    Here’s a simple plan that can help guide you through the process of breaking the sports-drink habit with little to no discomfort:

    General Guidelines To Keep In Mind

    These elements of habit change have been instrumental in my ability to kick bad habits and pick up healthier ones:

    • Slow and Steady – You shouldn’t feel like you’re missing anything at first, but after 3-4 weeks you’ll notice a significant difference.
    • Consistency is Key – If you do feel a strong urge for more soda, then adjust your schedule. You may have gotten to aggressive. It’s better to lengthen your plan than to make it too difficult to follow and end up giving up. If you slip up a day or two, don’t worry about it. Just get back to your normal schedule.
    • Tracking is Half The Battle – The tracking may seem like a small piece but is actually critical. I have tracked many of my own habits over the years to help overcome them. The simple act of measuring something makes me more aware of it which is at least half the battle.
    • Celebrate The Wins – You can track the amount of sugar you’re taking out of your diet and the amount of money you’re saving… then celebrate them! I’ve found that taking a moment to congratulate myself after hitting a milestone significantly boosts my motivation to continue. 
    • Substitutions and Adjustments – You may also want to experiment substituting your soft drink with something healthier like flavored sparkling water.

    Week 1-2: Initial Reduction

    1. Baseline Measurement: Determine your average daily consumption of soft drinks. A simple estimate will do just fine, but I highly recommend starting to track your intake as soon as possible. Note the time of day you typically drink soda… your body will expect its treat at similar times each day.
    2. Initial Cutback: Reduce your daily intake by 10-25%. You can ramp this up slowly every few days.
      • High Intake – If you typically drink ~4 bottles a day, cut back by drinking 75% of each can instead of 100%. Instead of trying to cut out 1 can, which will leave you empty-handed at one part of you day, just cut back on volume. Rather than trying to resist finishing the last 25%, pour out the first 25%. These small adjustments will reduce the amount of self-discipline needed to keep you on schedule.
      • Low Intake – If you’re drinking 1 can or less per day, you can try pouring the first 25% out or switch to the newer, small cans / bottles if available.

    Week 3-4: Further Reduction

    1. Halfway Point: Aim to reduce your consumption to half of the original amount by the end of week 4. If this is too aggressive, adjust your schedule. Remind yourself that getting to the end goal slower is much better than never getting there.
    2. Mindful Drinking: Be conscious of when and why you’re drinking a soft drink. Reviewing your tracking log will likely be very revealing by this point. Are you drinking soft drinks purely out of habit, for energy, or with meals?

    Week 5-6: Substantial Cutback

    1. Major Reduction: Cut down to 25% of your original intake. You may even be able to reduce the times per day you reach for that soft drink.
    2. Consider Alternatives: You may find it helpful to do a substitution at this point. Flavored water is great starting point and almost all brands come in aluminum cans.

    Week 7-8: Minimal Intake

    1. Occasional Treat: After going through this process myself with soda, fast food, and coffee… I still consume them but much less frequently. Instead of a mindless habit or an essential part of my day, they have become an occasional treat. I’ve noticed a significant difference in how I feel and I’ve drastically reduced my environmental footprint.
    2. Reflect on Progress: Observe any positive changes in your health or energy levels, which can be motivating. Don’t forget to celebrate the wins!

    The Economics of Divesting

    You might find it amazing how much money you’ll save by reducing the number of bottled beverages you buy (check out my video here which covers the environmental and economic savings in this regard). You’ll also stop supporting companies that create single-use packaging.

    Strategy 3: Use A Home Soda Machine

    A machine that enables you to make your own soft drinks at home can be a more environmentally friendly option over time, depending on how many bottles you displace.

    To evaluate the environmental impact of a home carbonation system versus single-use bottles, we need to consider several factors within the three main phases of their life cycle: production, usage, and disposal.

    Home Carbonation System

    1. Production: Manufacturing a home carbonation system involves the production of the machine, reusable bottles, and carbon dioxide canisters. This process requires energy and resources but is a one-time environmental cost for the lifespan of the product.
    2. Usage: The primary environmental benefit comes from the reuse of bottles and the reduction in the need for single-use plastic bottles. The carbon dioxide canisters used in these systems are often refillable or recyclable.
    3. Disposal: At the end of its life, the carbonation machine and its components need to be disposed of. If not recycled properly, they can contribute to electronic and plastic waste.

    Single-Use Bottles

    1. Production: The production of single-use plastic bottles is resource-intensive, involving the extraction and processing of petroleum products, significant water usage, and greenhouse gas emissions. As detailed above, aluminum and glass have their own environmental impacts to consider.
    2. Usage: Single-use bottles, once used, contribute to waste and often end up in landfills or as litter, where they take hundreds of years to decompose.
    3. Recycling: While these bottles are recyclable, the recycling rate is relatively low. Recycling also requires energy and resources, and recycled materials often have downgraded quality.

    Comparative Impact

    • Resource Efficiency: The home carbonation system, over its lifespan, typically uses fewer resources per liter of carbonated water produced compared to single-use bottles.
    • Waste Reduction: Home systems significantly reduce the amount of plastic waste generated.
    • Carbon Footprint: The initial carbon footprint of manufacturing a carbonation system is higher, but over time, it becomes more environmentally friendly compared to the continuous production of single-use bottles.

    While the upfront environmental cost of a home carbonation system is higher, in the long term, it is more environmentally friendly than the continual use of single-use bottles. This is due to reduced plastic waste, lower resource usage per use, and the potential for recycling components of the system. For individuals who consume carbonated beverages regularly, a home carbonation system could be a more sustainable choice.

    Final Thoughts

    For me, an important aspect of employing these strategies is that it sends a signal to friends, family, and companies. It shows each of them that we can live with less plastic and hopefully speeds up our transition to a more sustainable world.

    If you have further tips on reducing plastic use, let us know by commenting or reaching out to us on one of our social media channels.

    How To: Reduce Plastic Waste From Sports Drinks

    Strategy 1: Use Concentrate Instead of Pre-Packaged

    Instead of buying sports drinks in single-use plastic bottles, use a reusable bottle + concentrates. 

    To understand both the plastic and economic impact of buying bottled sports drinks vs powdered mixes or concentrates, let’s look at Gatorade – the original sports drink.

    Video Breakdown: Economic & Environmental Impact

    Here’s what the difference is between buying bottled Gatorade vs a concentrate or powder mix. I break this down by cost in dollars and amount of plastic produced per serving.

    Key Takeaways:

    • Least Expensive: Powder (Paper Container)
    • Least Plastic: Powder (Paper Container)
    • Most Expensive: Bottled Gatorade is much more expensive per serving
      • A single bottle is 6x as expensive as the powder concentrated alternative
      • A 12 pack of bottles is 2.6x as expensive as the powder concentrated alternative
    • Most Plastic: Bottled Gatorade by far uses the most plastic per serving
      • 6x as much plastic as powder in a plastic container
      • 90x as much plastic as powder in a paper container (plastic lid)
      • 14x as much as the liquid concentrate

    Hydration Powders

    Summary

    Here is a comparison chart of the top hydration powders on the market.

    Serving Size Variations

    Each brand recommends a slightly different serving size. The Cost per Serving I have included here is specific to each brand’s recommendation. Here is a break down of costs and servings for each brand:

    BrandPrice (Amazon)ServingsRecommended Serving SizeCost per Serving
    Liquid I.V.$24.991616oz$1.56
    Hydralyte$28.76308oz$0.96
    Skratch Labs$21.932012-16oz$1.10
    LMNT$21.591216-32oz$1.80
    Gatorade$11.883820oz$0.31

    Plastic Content of Packets

    Most packets are composed of paper with a plastic lining. When tearing a packet open, you can see the plastic lining on the inside.

    I have not been able to find reliable sources about the life cycle of these types of packets or details on their composition. It is clear however, that although there is some plastic it is minuscule in comparison to single-use bottles.

    Recommendations for Hydration Brands

    All brands deliver a similar mixture of salts and sugars in slightly different recipes (LMNT is and exception as it’s sugar free). Here are some recommendations based on common preferences:

    No Sugar: LMNT

    Ingredients: Salt (Sodium Chloride), Citric Acid, Magnesium Malate, Potassium Chloride, Natural Flavors, Stevia Leaf Extract

    Low Sugar: Hydralyte

    Ingredients: Dextrose (Anhydrous), Sodium, Chloride, Potassium, Folate, Vitamin C, Vitamin B12, Apple Cider Vineger, Citrate, Natural Flavors, Silicon Dioxide, Organic Stevia, Rebaudioside A.

    Low Price: Gatorade

    Ingredients: Sugar, dextrose, citric acid, salt, sodium citrate, monopotassium phosphate, calcium silicate, modified food starch, natural and artificial flavor, yellow 5.

    Most Vitamins: Liquid I.V. – Has Vitamin C and a mix of B Vitamins

    Ingredients: Pure Cane Sugar, Dextrose, Citric Acid, Salt, Potassium Citrate, Sodium Citrate, Dipotassium Phosphate, Silicon Dioxide, Rebaudioside-a (Stevia Leaf Extract), Natural Flavors, Vitamin C (Ascorbic Acid), Vitamin B3 (Niacinamide), Vitamin B5 (D-Calcium Pantothenate), Vitamin B6 (Pyridoxine Hydrochloride), Vitamin B12 (Cyanocobalamin).

    Strategy 2: Make Your Own

    Now that we’ve seen the ingredients for the leading hydration brands, making your own doesn’t seem too challenging. There are a host of recipes and how-to videos on the subject that will be able to guide you down this path much better than I can.

    The more ingredients you can find that don’t require plastic packaging, the better! If you’re able to create your own hydration drink without the use of plastic packaging along the way, let us know how you did it in the comments.

    Strategy 3: Taper To Alternative

    Reducing the amount of sports drinks you consume might be the best strategy if you’ve developed a habit of grabbing a sports drink even when you don’t need it. Most of the time we think we need an electrolyte drink, we don’t.

    Hydration drinks are recommended by most doctors only when signs of electrolyte imbalance start to occur or during extended and extraneous exercise when an imbalance is likely to occur. For most of us, this is a rare occasion. You can learn more about symptoms of electrolyte imbalance and alternatives to electrolyte drinks from the experts at Scripps.

    I used to have the habit of grabbing a sports drink in lieu of water. After learning this was unnecessary and significantly increasing my sugar intake, I kicked the habit the same way I overcame my morning caffein addiction: a slow wean.

    Here’s a simple plan that can help guide you through the process of breaking the sports-drink habit with little to no discomfort:

    General Guidelines To Keep In Mind

    • Slow and Steady – Each week you should only be able to notice a very slight difference in the taste of your sports drink.
    • Consistency is Key – If you feel a strong urge for a sports drink or that the diluted version is too weak, adjust the timing and dilution accordingly. If you slip up a day or two, don’t worry about it. Just get back to your normal schedule.
    • Tracking is Half The Battle – The tracking may seem like a small piece but is actually critical. I have tracked many of my own habits over the years. The act of simply writing down each time I take a certain action I’m trying to adjust makes me more aware of it which is at least half the battle.
    • Celebrate The Wins – You can track the amount of sugar you’re taking out of your diet and the amount of money you’re saving… then celebrate them! I’ve found that taking a moment to congratulate myself after hitting a milestone boosts my motivation considerably.
    • Substitutions and Adjustments – You may also want to experiment with some ingredients from Strategy 2, or even a dash of lemon juice to help make plain water not feel so boring. Tweak the regimen to fit your needs and to optimize for your desired outcome.

    Week 1-2: Initial Dilution

    1. Baseline Measurement: Start by measuring how much sports drink you consume daily. A notebook or the Notes app on your phone should suffice.
    2. Initial Dilution: Replace 25% of your sports drink with water. For example, if you drink 4 cups of sports drink daily, replace 1 cup with water. If drinking from a bottle, pour a 1/4 into another container and then fill the rest with water. If using a mix, just use 3/4 of what you would normally use.

    Week 3-4: Increased Dilution

    1. Increased Water Ratio: Now, replace 50% of the sports drink with water.
    2. Taste Adjustment: Your taste buds will begin adjusting to less sweetness. Stay attentive to how your body feels with this change. You can adjust up or down a little bit accordingly. The key is to make the change slight, so it’s easy to manage and you can keep your streak going.

    Week 5-6: Further Reduction

    1. Majority Water: Increase the water content to 75%, reducing the sports drink to just a quarter of your intake. At this point you should be adding sports drink to water instead of the other way around.
    2. Progress Check: You’re drinking half as much sugar and you’re probably noticing that you aren’t any less hydrated and may actually feel better.

    Week 7-8: Nearly There

    1. Minimal Sports Drink: Reduce the sports drink to just a small splash, about 10% of your drink, with the rest being water. You may even be able to use a substitute at this stage like a dash of lemon juice.
    2. Observe Changes: Notice any changes in your energy levels or how you feel overall. This can be motivating.

    Week 9+: Transition to Water

    1. Complete Transition: Now, switch entirely to water.
    2. Flavor Alternatives: If you miss the flavor, consider adding natural flavors to your water, like a slice of lemon, cucumber, or mint leaves.

    Additional Tips:

    • Track Your Progress: Keep a journal or use an app to track your daily intake and progress. This helps with awareness of your intake and motivation as you can look back and see how much sugar (and plastic) you’ve cut out of your diet.
    • Mindful Drinking: Going forward, be conscious of why you’re drinking sports drinks (for taste, habit, energy) and how water can be a healthier alternative.

    Next Steps

    If this guide has helped you to reduce your plastic use, let us know about it by commenting here or sending us a note on one of our social media channels.

    AND if you have additional recommendations related to this topic, let us know so we can share with the community. Thanks!

    Explained: How Number of Uses Changes Environmental Impact of Water Bottles

    How does the number of times I use a water bottle change its environmental impact?

    Video Highlights: Understanding the Environmental Impact of Water Bottles: A Deep Dive into Reusables vs. Single-Use

    Introduction
    In this video I dive into the environmental impacts of water bottles, focusing on the comparison between reusable and single-use bottles. I explore several key factors that influence their overall environmental footprint, such as global warming potential, production costs, and usage patterns.

    Main Points of the Video

    1. The Impact of Reusability (00:00 – 00:30)
    • I explain how the number of times a reusable water bottle is used significantly reduces its global warming potential and environmental impact. This aspect is crucial in understanding the sustainability of water bottles.
    1. Breakeven Point of Reusables vs. Single-Use (00:30 – 01:00)
    • The concept of the ‘breakeven point’ is critical. This is the number of uses a reusable bottle needs to surpass to become more eco-friendly than a single-use bottle.
    1. Production Phase and Its Impact (01:00 – 01:30)
    • I highlight that the production phase of water bottles, whether single-use or reusable, contributes significantly to their environmental impact. This phase includes the resources used, manufacturing, packaging, and delivery.
    1. Lifecycle Analysis of Water Bottles (01:30 – 02:00)
    • The lifecycle analysis of water bottles is broken down into three main phases: production, use, and post-use (or disposal). Each phase has a varying impact on the bottle’s overall environmental footprint.
    1. Global Warming Potential of Different Materials (02:00 – 02:30)
    • I discuss how different materials (glass, aluminum, plastic, steel) used in water bottles have distinct global warming potentials and environmental impacts, which change with the frequency of use.
    1. Practical Implications and Consumer Choices (02:30 – 03:00)
    • I emphasize the practical implications of these findings for consumers. Choosing to reuse a water bottle, whether it’s a specifically designed reusable or even a single-use bottle, can significantly reduce environmental impact.

    Explained: Life Cycle Analysis (LCA) of Water Bottles

    How LCAs for Water Bottles Work

    This video explains the life cycle analysis (LCA) of water bottles, focusing on the three main phases: production, use, and end-of-life.

    Key moments with timestamps:

    • 0:00-1:00: Introduction to LCA and the three phases for water bottles.
    • 1:00-2:30: Breakdown of the production phase, highlighting its significant impact and various data inputs like resource extraction, manufacturing, packaging, and beverage production.
    • 2:30-3:30: Explanation of the use phase for single-use water bottles, including transportation, washing, and refrigeration.
    • 3:30-4:30: Comparison of the use phase for single-use and reusable water bottles, emphasizing the longer use cycle and additional washing factor for reusables.
    • 4:30-5:30: Discussion of the end-of-life phase and its dependence on disposal methods like recycling or landfilling.
    • 5:30-6:30: Comparison of the life cycle of single-use and reusable water bottles using a diagram, showcasing the significant impact of the production phase for both.

    Additional details:

    • The video mentions that most of the impact for water bottles comes from the production phase.
    • The use phase for single-use water bottles is relatively low compared to production.
    • The life cycle analysis of reusable water bottles includes factors like the number of uses and the source of water.
    • Different studies may have different assumptions and scenarios, leading to variations in the results.

    Data Sources

    [1] Environmental Life Cycle Assessment of Drinking Water Alternatives and Consumer Beverage Consumption in North America (Access)

    [2] Life cycle assessment of single-use and reusable plastic bottles in the city of Johannesburg (Access)

    Olatayo KI, Mativenga PT, Marnewick AL. Life cycle assessment of single-use and reusable plastic bottles in the city of Johannesburg. S Afr J Sci. 2021;117(11/12), Art. #8908. https://doi.org/10.17159/ sajs.2021/8908

    [3] Reusable vs Single-Use Packaging: A Review of Environmental Impacts (Access)

    Which Single-Use Water Bottles Have The Most Plastic?

    Single-Use Plastic Bottles Ranked by Plastic Content

    Graph of Brands & Plastic Content

    Table of Brands & Plastic Content

    This table shows the data used for the graph above. It shows each brand and the plastic content for its 500mL bottle in grams. The cap is excluded from the weight. The bottles are weighed without water.

    The average weight from this group of water bottles is 17.7g. The Difference from Avg. column shows how much more or less plastic the brand’s bottle has in comparison to the average.

    BrandBottle Weight (g) (w/o cap)Difference from Avg.
    Nestle Eco-Shape Bottle12.37-30%
    Niagara12.6-29%
    Costco12.73-28%
    Food Lion12.77-28%
    Crystal Springs12.79-28%
    Crystal Geyser12.91-27%
    Albertsons Natural Spring Water12.99-27%
    Absopure13.11-26%
    Sunset Foods-Centrella Spring13.11-26%
    Albertsons Purified Drinking Water13.12-26%
    Hannaford Spring Water13.15-26%
    Meijer13.15-26%
    Stater Bros. Pure Water13.16-26%
    Safeway-Refreshe13.31-25%
    Diamond Springs13.5-24%
    Safeway-Refreshe Spring Water14.02-21%
    Rite Aid (Crystal Lake)14.14-20%
    WalMart (Great Value)14.32-19%
    Roxanne Mountain Spring Water14.35-19%
    Sparkletts14.52-18%
    Acadia14.78-16%
    Walgreens-Spring Water14.94-16%
    7-Eleven14.98-15%
    Dasani15.07-15%
    Aquafina (New)15.12-15%
    CVS Spring Water15.15-14%
    Wild Oats-Whole Foods15.52-12%
    Kroger15.59-12%
    Savalas15.59-12%
    Shop Rite15.59-12%
    Volvic Spring Water16.91-4%
    Evian17.05-4%
    Publix17.06-4%
    Spring!17.11-3%
    HEB17.12-3%
    Walgreens-Pure American17.18-3%
    Odwalla17.21-3%
    Drug Mart-Aqua Pura Purified Water17.47-1%
    Spring! By Dannon17.52-1%
    CVS Spring Water-Pop Cap18.585%
    Deja Blue19.058%
    Deja Blue – Pop Cap19.128%
    Iceland Springs20.1314%
    Evamor20.6317%
    Aquafina21.521%
    Ethos Water21.5622%
    Aqua Panna S. Pellegrino23.1631%
    Gerolsteiner23.6434%
    80 Degrees North23.7234%
    Tynant Spring Water23.9435%
    Iceland Pure2436%
    Isbre24.0336%
    Penta25.6845%
    Fiji26.147%
    Voss41.3133%

    About This Data

    Our investigation was based on a life cycle assessment study that included data for the weights of various 500ml water bottles from a wide selection of brands. This method provided a clear picture of the plastic content in these ubiquitous products.

    Results

    On average, a water bottle, sans cap and water, weighs about 17.7 grams. However, there’s significant variation among brands, with weights ranging from 12 to 41 grams.

    The single use bottles with the most plastic content were Fiji, Voss, and Penta. Voss stood out, containing more than double the average bottle’s plastic. Fiji and Penta were also high on the list, with 47% and 45% more plastic than the average bottle, respectively.

    What The Data Does Not Include

    The data does not include every water bottle brand on the market and therefore is not exhaustive, but does give us an interesting look into the landscape.

    The data also doesn’t account for bottles using recycled plastic content. We are looking into this and will follow up with another post that takes this into consideration.

    Data Source:

    Environmental Life Cycle Assessment of Drinking Water Alternatives and Consumer Beverage Consumption in North America (Access)

    • About The Report: This is the most comprehensive and relevant life cycle analysis study on topic we’ve been able to find. While it was commissioned by Nestle Waters North America, it was done so with a stated mission to understand how to reduce their environmental footprint, is clear about the intentions of the project, and was reviewed by a panel of experts outside Quantis (the team commissioned for the study).  
    • The final report was published on Feb 1, 2010.